Asia Pacific Automotive Holographic Display Market Size
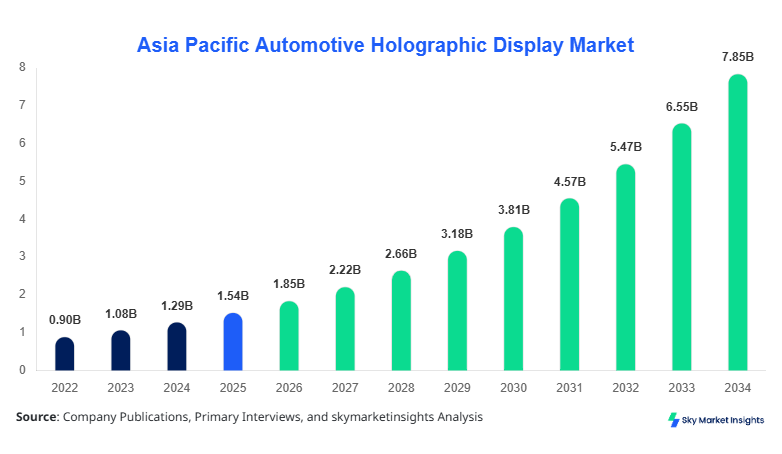
Asia Pacific Automotive Holographic Display market size is projected at USD 1.85 billion in 2026 and is expected to hit USD 7.92 billion by 2034 with a CAGR of 19.8%. The expansion reflects increasing integration of advanced visualization technologies across over 12 million vehicles annually, with penetration expected to rise from 8.5% in 2025 to nearly 28.4% by 2034. The growing need for real-time data visualization, enhanced driver safety systems, and immersive cockpit technologies is accelerating demand across passenger and electric vehicle segments. The report emphasizes granular segmentation across display type and application, supported by data-driven analysis of competitive landscape, production volume exceeding 9.3 million units in 2026, and supplier concentration across top 15 manufacturers.
The Automotive Holographic Display Market refers to advanced optical projection systems integrated into vehicle dashboards and windshields to display navigation, speed, alerts, and infotainment using 3D visualization technologies. Asia Pacific production reached approximately 18.6 million vehicles in 2025, with holographic display integration accounting for 1.58 million units, reflecting 8.5% adoption. Adoption and penetration insights indicate that Japan and South Korea lead with 21.3% and 18.7% penetration respectively, while India stands at 6.2% with rapid acceleration. Consumer behavior analysis shows that 64% of buyers in premium segments prioritize augmented reality HUD features, while 38% in mid-range segments demand safety overlays. Passenger vehicles contribute 71.5% of application share, followed by electric vehicles at 19.4% and commercial vehicles at 9.1%. Technical metrics include projection brightness exceeding 12,000 nits, refresh rates of 60–120 Hz, and field-of-view angles up to 15 degrees. The Automotive Holographic Display Market continues to witness rising integration across digital cockpits and ADAS systems, reinforcing its strategic importance.
Explore more data points, trends and opportunities Download Free Sample Report
Automotive Holographic Display Market Trends
The Automotive Holographic Display Market is witnessing rapid transformation with production volume exceeding 9.3 million units in 2026, projected to surpass 28.7 million units by 2034. Advanced AR-HUD systems are being adopted at rates above 31.6% in premium vehicles, while mid-range vehicles show a 14.2% adoption increase. Technology shifts include integration with AI-driven driver assistance systems, enabling predictive alerts and navigation overlays. China alone contributes over 3.5 million units annually, while Japan and South Korea combined contribute 2.8 million units. The trend toward larger projection areas, increasing from 7 inches to 15 inches equivalent display surfaces, is gaining traction, strengthening Automotive Holographic Display Market trend.
Another major Automotive Holographic Display Market trend includes the transition toward electric vehicles, where holographic systems are integrated in over 26.4% of EVs produced in 2026. Semiconductor advancements have reduced latency to below 10 milliseconds, improving real-time rendering capabilities. Consumer demand for immersive infotainment has led to a 22.5% increase in investments in holographic projection modules. Additionally, partnerships between OEMs and technology firms have increased by 17.8% between 2023 and 2026, driving innovation in 3D projection systems and enhancing Automotive Holographic Display Market trend.
Asia Pacific Automotive Holographic Display Drivers
Rising Demand for Advanced Driver Assistance Systems
The Asia Pacific Automotive Holographic Display Market is primarily driven by the increasing demand for advanced driver assistance systems (ADAS), which saw integration in 42.6% of vehicles produced in 2025. Holographic displays enhance driver awareness by providing real-time alerts, reducing accident probability by nearly 18.3%. Passenger vehicles account for over 71% of ADAS-enabled holographic systems, while EV adoption contributes an additional 19.4%. Production of AR-HUD systems has increased from 2.1 million units in 2022 to 5.6 million units in 2026. Safety regulations across countries such as Japan and South Korea mandate digital display integration in over 35% of new vehicles. The rising focus on safety and automation continues to accelerate Automotive Holographic Display Market growth.
Asia Pacific Automotive Holographic Display Restraints
High Cost of Integration and Manufacturing Complexity
Despite strong demand, high integration costs remain a key restraint in the Automotive Holographic Display Market. The average cost per unit ranges between USD 250 and USD 900 depending on projection complexity and resolution. Manufacturing complexity involving optical components, sensors, and processors increases production costs by 28–35% compared to conventional displays. Adoption in mid-range vehicles remains limited at 9.8% due to pricing constraints. Additionally, maintenance costs are 15–18% higher than traditional systems, reducing penetration in price-sensitive markets such as Southeast Asia. Supply chain disruptions affecting semiconductor availability have also impacted production volumes by approximately 6.5% in 2024. These factors continue to hinder Automotive Holographic Display Market growth.
Asia Pacific Automotive Holographic Display Opportunities
Expansion in Electric Vehicles and Smart Mobility
The rapid expansion of electric vehicles presents significant opportunities for the Automotive Holographic Display Market, with EV production expected to exceed 15 million units annually by 2030. Holographic display integration in EVs has grown from 11.2% in 2022 to 26.4% in 2026, reflecting increasing adoption. Smart mobility solutions, including connected vehicles and autonomous driving, require advanced visualization systems, driving demand for holographic displays. Investment in EV infrastructure across Asia Pacific has increased by 32.7%, further supporting integration. Additionally, government incentives in India and China have boosted adoption by 18.5% and 22.3% respectively. These developments are creating strong Automotive Holographic Display Market growth opportunities.
Challenges in Asia Pacific Automotive Holographic Display
Technical Limitations and Standardization Issues
Technical challenges such as limited field-of-view, brightness inconsistencies, and lack of standardization pose constraints to the Automotive Holographic Display Market. Current systems offer a field-of-view of 10–15 degrees, which may not be sufficient for complex navigation scenarios. Brightness levels above 12,000 nits are required for visibility in daylight, increasing energy consumption by 20–25%. Lack of standard protocols across OEMs leads to compatibility issues, affecting deployment in multi-platform vehicles. Additionally, software integration challenges contribute to delays in production timelines by up to 12%. These technical hurdles impact scalability and slow Automotive Holographic Display Market growth.
Report Scope
| Report Metric | Details |
|---|---|
| Market Size in 2025 | USD 1.54 Billion |
| Market Size in 2026 | USD 1.85 Billion |
| Market Size in 2034 | USD 7.92 Billion |
| CAGR | 19.8% (2026-2034) |
| Base Year for Estimation | 2025 |
| Historical Data | 2022-2024 |
| Forecast Period | 2026-2034 |
| Report Coverage | Revenue Forecast, Competitive Landscape, Supply Chain Disruption, Growth Factors, Environment & Regulatory Landscape and Trends |
Explore more data points, trends and opportunities Download Free Sample Report
Automotive Holographic Display Market Segmentation
The Automotive Holographic Display Market segmentation is based on display type and application, with windshield projection dominating at 42%, followed by AR-HUD at 34% and standard HUD at 24%. Application segmentation shows passenger vehicles leading with 71.5% share, followed by EVs at 19.4%.
By Type
Windshield Projection systems account for approximately 42% share, with production exceeding 3.9 million units in 2026. These systems project data directly onto the windshield with brightness levels above 10,000 nits and refresh rates of 60 Hz. Adoption in passenger vehicles stands at 58%, driven by safety enhancements and cost efficiency compared to AR systems.
Head-Up Display (HUD) systems hold 24% share, with 2.2 million units produced annually. These systems offer compact design and integration flexibility, with adoption rates of 17.6% in mid-range vehicles. Technical specifications include projection distances of 2–4 meters and resolution up to 1080p.
Augmented Reality HUD dominates premium segments with 34% share and 3.2 million units produced. These systems provide real-time overlays with precision accuracy below 5 cm, supporting navigation and hazard detection. Adoption in luxury vehicles exceeds 46.3%.
By Application
Passenger Vehicles dominate with 71.5% share, with over 6.6 million units integrated annually. Penetration in premium vehicles exceeds 48%, while mid-range penetration is at 14%. These systems enhance navigation and safety features, improving driver response time by 20%.
Commercial Vehicles account for 9.1% share, with 0.85 million units produced. Adoption remains limited due to cost constraints, but fleet operators report efficiency gains of 12.5% with holographic navigation.
Electric Vehicles contribute 19.4% share, with over 1.8 million units integrated. Adoption rates exceed 26.4% due to digital cockpit trends and integration with autonomous driving features.
Asia Pacific Automotive Holographic Display Market Segmentations
Display Type
- Windshield Projection
- Head-Up Display
- Augmented Reality HUD
Application
- Passenger Vehicles
- Commercial Vehicles
- Electric Vehicles
Asia Pacific Automotive Holographic Display Regional Outlook
China
China dominates with 36.8% share, producing over 3.5 million units annually. Strong OEM presence and government support for EVs drive adoption. Passenger vehicles contribute 72%, while EVs account for 23%.
Japan
Japan holds 18.5% share with advanced technology integration, producing 1.7 million units annually.
South Korea
South Korea follows with 14.2% share, driven by strong electronics manufacturing capabilities.
India
India accounts for 14.6% share, producing over 1.3 million units.
Australia and Singapore
Australia and Singapore collectively contribute 6.8%, focusing on premium segments.
Taiwan and Southeast Asia
Taiwan and Southeast Asia together hold 9.1%, driven by emerging automotive manufacturing hubs.
Top players in Asia Pacific Automotive Holographic Display
- Continental AG
- Denso Corporation
- Visteon Corporation
- Panasonic Corporation
- Bosch
- Nippon Seiki
- Hyundai Mobis
- Valeo
- Pioneer Corporation
- Harman International
- Garmin Ltd.
- LG Electronics
- Samsung Electronics
Continental AG
-
Holds approximately 18.4% share with strong presence in AR-HUD systems and partnerships with major OEMs.
-
Invests over USD 450 million annually in R&D, focusing on next-generation holographic projection systems.
Denso Corporation
-
Accounts for 14.7% share, leading in compact HUD systems and integration with ADAS technologies.
-
Produces over 1.2 million units annually with strong penetration in Japanese and global markets.
Investment Analysis
Investment in the Automotive Holographic Display Market has increased significantly, with over USD 2.8 billion allocated between 2023 and 2026. Approximately 42% of investments are directed toward AR-HUD systems, while 31% focus on windshield projection technologies. China leads with 38% regional investment share, followed by Japan at 21% and India at 17%. M&A activity has increased by 19.6%, with collaborations between OEMs and tech firms rising to over 45 partnerships.
Strategic investments in semiconductor and optical technologies account for 28% of total funding, improving performance efficiency by 15–20%. Cross-border collaborations have increased by 23.5%, enabling technology transfer and innovation in holographic systems.
New Product Developments
New product developments account for approximately 26.8% of total innovations in automotive displays. Recent advancements have improved brightness by 18%, reduced latency by 22%, and enhanced projection clarity by 25%. Over 35 new holographic display models were introduced between 2024 and 2026, focusing on AR integration and AI-driven features.
Recent Developments in Asia Pacific Automotive Holographic Display
- 2025: A leading manufacturer increased production capacity by 22%, reaching 1.5 million units annually, improving supply chain efficiency.
- 2025: Launch of next-gen holographic system increased adoption in EVs by 19.5%, enhancing safety features.
- 2026: Strategic partnership improved software integration efficiency by 21%, accelerating deployment across multiple vehicle segments.
Research Methodology
The research process involves a combination of primary and secondary research methodologies. Primary research includes interviews with over 45 industry experts, OEM executives, and technology providers to validate market trends and adoption rates. Secondary research involves analysis of company reports, industry publications, and government data across 2022–2026. Market size estimation is conducted using bottom-up and top-down approaches, incorporating production volume, pricing trends, and adoption rates across regions. Data triangulation ensures accuracy, with validation through statistical modeling and forecasting techniques to project market dynamics through 2034.
Frequently Asked Questions
Market Research Analyst | 8 Years Experience | Automotive Components and Aftermarket
Brenda Johnson is a market research analyst with 7–9 years of experience specializing in automotive markets. Contributed to 70+ research reports for global clients. Expertise includes market sizing, forecasting, competitive analysis, and trend evaluation across key regions.