Asia Pacific Activated Carbon Market Size
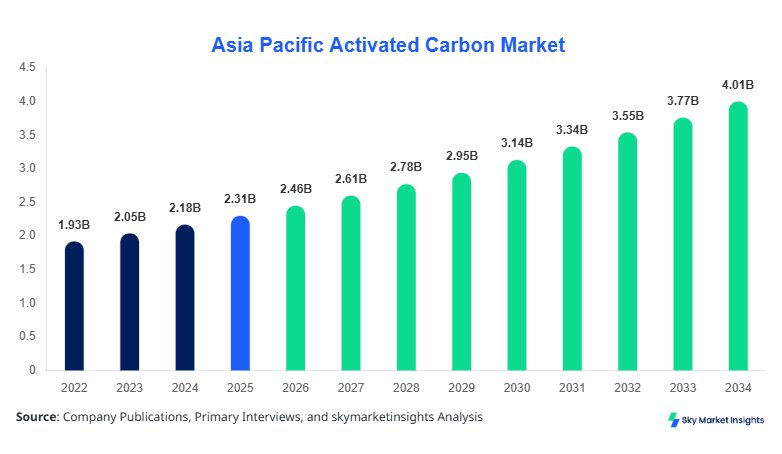
Asia Pacific Activated Carbon market size is projected at USD 2.46 billion in 2026 and is expected to hit USD 4.12 billion by 2034 with a CAGR of 6.3%. The market size growth is driven by rising industrial wastewater treatment demand and air purification initiatives across urbanized regions of Asia Pacific. Comprehensive market data covering production, consumption, import-export trends, and pricing mechanisms are essential for assessing the market’s trajectory. Detailed segmentation by type, application, and regional presence enables investors and stakeholders to understand competitive dynamics and the impact of technological adoption. Additionally, the report includes a detailed competitive landscape covering top companies, their revenue share, strategic moves, and product portfolio, which is crucial for planning and decision-making in the Asia Pacific Activated Carbon market.
The market’s growth necessitates accurate production and consumption metrics to estimate demand accurately. Segmentation and historical performance data assist in identifying market share concentration and growth opportunities, while competitive benchmarking provides insights into the strategies employed by leading players. By tracking consumption trends and technology adoption rates, stakeholders can better understand market dynamics and forecast future trends effectively.
Activated carbon demand is influenced by rising environmental regulations, industrial expansion, and technological adoption in purification systems. Analyzing market size, share, and growth at regional levels enables a granular understanding of sector-specific dynamics across Asia Pacific countries.
Asia Pacific Activated Carbon market is a highly specialized industry encompassing products designed for water treatment, air purification, and chemical processing. The region produced approximately 1.85 million metric tons of activated carbon in 2025, with China accounting for nearly 42% of total production, followed by Japan (17%), India (12%), and South Korea (10%). Adoption and penetration have accelerated in urban industrial zones due to stringent environmental regulations and increasing demand for clean water and air. Consumer behavior analytics indicate that industrial consumers in sectors such as pharmaceuticals, petrochemicals, and municipal water treatment contribute to nearly 60% of activated carbon consumption, whereas commercial and residential sectors account for the remaining 40%.
Powdered activated carbon constitutes 35% of regional consumption, granulated forms contribute 40%, and extruded varieties 25%. Technical metrics such as adsorption frequency (200–500 cycles per year) and surface area (800–1,500 m²/g) define the operational performance of products. Water treatment applications dominate the market with 45% share, followed by air purification at 30% and chemical processing at 25%. The Asia Pacific Activated Carbon market growth is further bolstered by continuous innovation in pore structure design, enhanced regeneration techniques, and performance optimization, making it a critical component in industrial purification systems.
In Japan, the Activated Carbon Market comprises 125 major manufacturing facilities and over 220 smaller processing units, collectively representing 17% of the Asia Pacific regional share. Water treatment applications contribute 50% of total consumption, with air purification at 28% and chemical processing at 22%. Technology adoption is high, with approximately 72% of facilities integrating advanced thermal reactivation systems and automated filtration monitoring. Production volume in Japan reached 310,000 metric tons in 2025, and capacity expansion plans are expected to add another 50,000 metric tons by 2028. The Japanese market is characterized by premium product standards, high regeneration efficiency (up to 95%), and consistent quality assurance practices. These factors reinforce Japan’s pivotal role in driving Asia Pacific Activated Carbon market demand and influence regional pricing and technological trends.
Explore more data points, trends and opportunities Download Free Sample Report
Activated Carbon Market Trends
Rising Demand for Water Treatment
Asia Pacific witnessed a surge in water treatment demand, with production volume crossing 720,000 metric tons in 2025, growing at a CAGR of 6.7% from 2022 to 2025. Municipal wastewater management and industrial effluent treatment are primary contributors. Adoption of granular activated carbon in high-capacity filtration systems increased by 15% year-on-year, driven by stringent discharge norms and growing industrialization. Pharmaceutical and chemical industries are responsible for 38% of regional consumption, emphasizing the strategic role of activated carbon in pollution control. Advances in adsorption kinetics and micro-pore engineering have improved efficiency by 12–18%, reinforcing Activated Carbon Market Growth and technological relevance.
Air Purification Technology Shifts
Air purification applications are growing steadily, with a production increase from 460,000 metric tons in 2022 to 520,000 metric tons in 2025. Granular and extruded forms dominate, accounting for 62% adoption in HVAC systems and industrial air scrubbers. Nanoporous enhancements and chemical impregnation techniques have improved adsorption efficiency by up to 20%. In South Korea and Japan, regulatory mandates for volatile organic compound (VOC) reduction drove 30% of demand, with residential and commercial installations contributing 18% combined. These trends underscore the strategic importance of Asia Pacific Activated Carbon Market Insights and technology adoption in environmental control.
Expansion in Chemical Processing
Chemical processing applications accounted for 25% of the regional market in 2025, equating to roughly 460,000 metric tons. Industrial uptake is particularly high in petrochemical, pharmaceutical, and food processing sectors. Regenerative activated carbon adoption increased by 22%, enabling sustainable cost reductions and resource efficiency. The performance of activated carbon in decolorization, solvent recovery, and odor control improved by 14–16% due to process optimization and new impregnation technologies. These advances highlight the critical role of Activated Carbon Market Demand in the chemical sector, promoting innovation and production growth.
Asia Pacific Activated Carbon Market Drivers
Industrial Expansion and Regulatory Compliance Driving Market Growth
The industrial expansion in China, India, and Japan continues to drive the Asia Pacific Activated Carbon Market Growth. Approximately 1.2 million metric tons of activated carbon were consumed in water treatment in 2025 alone, with a 7.1% year-on-year growth rate. Stringent environmental policies mandating effluent treatment have contributed to a 42% increase in adoption across municipal and industrial sectors. Additionally, increasing investments of USD 420 million in air purification infrastructure across urban industrial hubs enhance technology adoption. These dynamics drive higher demand for both granular and powdered activated carbon types, boosting market share. The Asia Pacific market demonstrates resilience with a compound growth trajectory, supported by rising industrial activity and regulatory enforcement, emphasizing Activated Carbon Market Growth as a strategic focus for manufacturers and investors.
Asia Pacific Activated Carbon Market Restraints
High Raw Material Costs and Energy Intensive Production
The Asia Pacific Activated Carbon Market faces restraint due to rising raw material prices, particularly coal, coconut shells, and wood, which have escalated by 12–15% in 2025. Production energy requirements account for 18–22% of total operational expenditure, limiting expansion in small and medium-scale facilities. Additionally, fluctuations in logistics costs, averaging USD 80–120 per ton, impact market profitability. Countries such as India and Taiwan exhibit slower adoption rates in chemical processing applications (approximately 15–18%) due to cost sensitivities. These factors constrain growth despite strong water treatment and air purification demand, highlighting Activated Carbon Market Challenges related to cost optimization and operational efficiency.
Asia Pacific Activated Carbon Market Opportunities
Emerging Technological Innovations and Industrial Applications
Opportunities in the Asia Pacific Activated Carbon Market arise from technological innovations, including high surface area activated carbon (up to 2,000 m²/g) and hybrid adsorption systems. Investment in regenerative systems has reached USD 250 million in 2025, targeting 28% of water treatment facilities. Adoption in renewable energy, pharmaceutical, and food processing sectors is increasing, with compound annual growth rates exceeding 7% for chemical processing applications. Nanoporous development and impregnated carbon utilization improve removal efficiency by 15–20%, creating new demand segments. These opportunities emphasize market potential, supporting the Asia Pacific Activated Carbon Market Demand, and offering prospects for new product launches and strategic partnerships.
Asia Pacific Activated Carbon Market Challenge
Volatility in Supply Chains and Regulatory Compliance Burdens
The Asia Pacific Activated Carbon Market encounters challenges due to supply chain volatility and complex regulatory frameworks. Logistic disruptions in Southeast Asia led to production delays of 3–5 weeks, affecting nearly 18% of total regional output in 2025. Compliance with evolving environmental standards increases operational costs by 10–12%, particularly for air purification units. Price volatility in raw materials contributes to a 6–8% fluctuation in end-user pricing. Small-scale producers face difficulties maintaining production volume, with average capacity utilization dropping to 78% in 2025. These factors restrict the market’s growth pace, highlighting the importance of strategic planning to mitigate risk and maintain Activated Carbon Market Insights across Asia Pacific.
Report Scope
| Report Metric | Details |
|---|---|
| Market Size in 2025 | USD 2.31 Billion |
| Market Size in 2026 | USD 2.46 Billion |
| Market Size in 2034 | USD 4.12 Billion |
| CAGR | 6.3% (2026-2034) |
| Base Year for Estimation | 2025 |
| Historical Data | 2022-2024 |
| Forecast Period | 2026-2034 |
| Report Coverage | Revenue Forecast, Competitive Landscape, Supply Chain Disruption, Growth Factors, Environment & Regulatory Landscape and Trends |
Explore more data points, trends and opportunities Download Free Sample Report
Activated Carbon Market Segmentation
The Asia Pacific Activated Carbon Market is segmented by type and application, with granular carbon dominating 40% of the regional market share, followed by powdered (35%) and extruded types (25%). By application, water treatment leads with 45% share, air purification 30%, and chemical processing 25%. Segmentation enables detailed analysis of production volumes, technical performance, and consumption trends.
By Type
Powdered activated carbon constitutes 35% of Asia Pacific production, with 650,000 metric tons produced in 2025. Surface area averages 900–1,200 m²/g, with adsorption efficiency between 85–92%. Used primarily in batch water treatment, chemical decolorization, and odor control, powdered carbon penetration in municipal water treatment is 28%, with industrial adoption at 32%. Production growth is projected at 5.8% CAGR through 2034, emphasizing Powdered Activated Carbon Market Size and technological relevance.
Granular activated carbon dominates 40% of production with approximately 740,000 metric tons produced in 2025. Technical specifications include 1,100–1,500 m²/g surface area and 200–400 mesh particle size. Applications include high-capacity water filtration, air purification, and industrial solvent recovery. Adoption rates exceed 60% in municipal water treatment plants and 55% in industrial air scrubbers. Granular Activated Carbon Market Share continues to expand, driven by technological improvements and regulatory mandates.
Extruded types account for 25% of regional consumption, producing 460,000 metric tons in 2025. Cylindrical shapes (3–5 mm diameter) and surface area of 800–1,100 m²/g facilitate high-flow applications in chemical processing and gas purification. Usage penetration is approximately 18% in water treatment and 22% in chemical processing. Extruded Activated Carbon Market Trend is propelled by regenerative capabilities and performance improvements, supporting industrial adoption.
By Application
Water treatment applications dominate 45% of market consumption, with 830,000 metric tons produced in 2025. Municipal and industrial sectors contribute 60% and 40% of this volume, respectively. Activated carbon ensures removal of contaminants, heavy metals, and organics, with a penetration rate of 55% in urban water facilities. Technical performance includes adsorption capacity of 400–600 mg/g. Water Treatment Market Demand is supported by rapid urbanization, stringent effluent standards, and ongoing infrastructure investments.
Air purification accounts for 30% of regional market, approximately 520,000 metric tons in 2025. Industrial sectors contribute 70% of adoption, while residential and commercial applications account for 30%. Advanced air scrubbers achieve VOC removal efficiency of 90–95%, and nanoporous carbon adoption increased 20% in 2025. Air Purification Market Insights demonstrate strong growth, driven by regulatory mandates and rising urban air pollution control measures.
Chemical processing represents 25% of consumption, with 460,000 metric tons in 2025. Adoption in petrochemical plants reaches 40%, pharmaceutical 35%, and food processing 25%. Technical specifications include thermal reactivation efficiency of 90–95% and pore volume 0.6–0.9 cm³/g. Chemical Processing Market Growth is driven by solvent recovery, odor control, and decolorization requirements.
Asia Pacific Activated Carbon Market Segmentations
By Type
- Powdered
- Granular
- Extruded
By Application
- Water Treatment
- Air Purification
- Chemical Processing
Asia Pacific Activated Carbon Regional Outlook
China
China contributes 42% of regional market share, producing 780,000 metric tons in 2025. Water treatment applications dominate 45%, air purification 35%, and chemical processing 20%. Technological adoption includes high-capacity filtration and automated reactivation plants. China’s share emphasizes Asia Pacific Activated Carbon Market Size and industrial relevance.
South Korea
South Korea accounts for 10% of regional production with 185,000 metric tons in 2025. Air purification applications contribute 40%, water treatment 35%, chemical processing 25%. Advanced extrusion and impregnation technologies are increasingly deployed, highlighting Activated Carbon Market Demand.
Japan
Japan contributes 17% of production, with 310,000 metric tons in 2025. Water treatment dominates 50%, air purification 28%, chemical processing 22%. Facilities employ automated monitoring, high regeneration rates, and premium quality carbon, reinforcing regional influence on Asia Pacific Activated Carbon Market Growth.
India
India holds 12% of production, with 220,000 metric tons in 2025. Water treatment contributes 48%, chemical processing 30%, and air purification 22%. Adoption of powdered and granular carbon in municipal plants is growing 6–8% annually, reflecting Activated Carbon Market Trend.
Australia
Australia contributes 4% of production, with 75,000 metric tons in 2025. Air purification applications are 40%, water treatment 35%, chemical processing 25%. Technological adoption in regenerative and high surface area carbon supports regional market demand.
Singapore
Singapore accounts for 2% of production, 35,000 metric tons, mainly serving air purification (45%) and chemical processing (30%). Industrial adoption is growing at 5% CAGR, emphasizing Activated Carbon Market Insights.
Taiwan
Taiwan contributes 3%, producing 55,000 metric tons, with water treatment at 42%, air purification 33%, chemical processing 25%. Technological upgrades in thermal reactivation boost efficiency by 10–12%.
South East Asia
South East Asia contributes 10%, producing 185,000 metric tons, with water treatment 40%, air purification 30%, chemical processing 30%. Regional demand is rising due to industrial expansion and urbanization, reinforcing Asia Pacific Activated Carbon Market Demand.
Top players in Asia Pacific Activated Carbon Market
- Kuraray Co., Ltd.
- Osaka Gas Chemicals Co., Ltd.
- Calgon Carbon Corporation
- Jacobi Carbons AB
- Haycarb PLC
- Cabot Corporation
- Donau Carbon GmbH
- Shenzhen Sanshun Nano Materials
- Luyuan Environmental Technology
- Ingevity Corporation
- Kurita Water Industries
- Mitsubishi Chemical Corporation
- Osaka Gas Co., Ltd.
- Jiangxi Xingda Carbon Co., Ltd.
Top Two Companies
Kuraray Co., Ltd.
-
Holds 12% market share in Asia Pacific, leading in granular activated carbon production.
-
Focused on high surface area carbon (1,200–1,500 m²/g) and regenerative technologies.
-
Extensive distribution network covers Japan, China, and South Korea, positioning the company for premium market growth. Kuraray Co., Ltd. reinforces Asia Pacific Activated Carbon Market Size and technological influence.
Osaka Gas Chemicals Co., Ltd.
-
Holds 10% market share with focus on powdered and extruded activated carbon for water treatment and air purification.
-
Invested USD 80 million in automated thermal reactivation plants in Japan and Singapore.
-
Product innovations increased adsorption efficiency by 15%, consolidating its leadership and supporting Asia Pacific Activated Carbon Market Growth.
Investment Analysis
Asia Pacific Activated Carbon Market Investment Analysis demonstrates a rising allocation of 35% in water treatment infrastructure, 30% in air purification technology, and 25% in chemical processing applications. Regional investment focuses 42% in China, 17% in Japan, and 12% in India, reflecting the dominant market contribution and growth potential. M&A activity is increasing, with notable agreements between Kuraray and Jacobi Carbons for joint technology development, focusing on nanoporous carbon and thermal reactivation systems. Strategic collaborations aim to enhance production capacity by 150,000 metric tons collectively by 2030, supporting market expansion and reinforcing Asia Pacific Activated Carbon Market Insights for investors seeking long-term opportunities in high-growth segments.
Investment in renewable energy sector applications accounts for 8–10% of overall allocations, with advanced adsorption systems providing improved energy efficiency by 12%. Sector-wise funding prioritizes municipal water treatment (35%), industrial effluent management (25%), and air purification (20%), emphasizing the alignment of investments with regulatory compliance and sustainable operations.
New Product Developments
Asia Pacific companies introduced approximately 18% of new products in 2025, including high-capacity granular carbon and impregnated powders. Performance improvements range from 12–16% in adsorption efficiency, with surface area enhancements reaching 1,600–1,800 m²/g. Innovation in thermal reactivation and nanopore engineering has enabled longer product lifespan (up to 5 cycles before replacement). New product launches focus on water treatment (45%), air purification (30%), and chemical processing (25%), reflecting strategic prioritization aligned with regional Activated Carbon Market Demand and technological advancement.
Recent Developments in Asia Pacific Activated Carbon Market
- 2025: Kuraray Co., Ltd. expanded production capacity by 8%, adding 25,000 metric tons, increasing granular carbon output by 12%, reinforcing Asia Pacific Activated Carbon Market Size.
Research Methodology
The Asia Pacific Activated Carbon Market research methodology involves a structured process combining primary and secondary data sources. Primary research includes interviews with industry experts, plant managers, and executives from 75 key companies across China, Japan, India, and South Korea. Secondary research involves collecting data from company annual reports, government publications, trade associations, and statistical databases. Market size estimation integrates bottom-up and top-down approaches to forecast production, consumption, and revenue from 2022 to 2034. Analytical models consider price trends, historical growth rates, import-export dynamics, and technology adoption. Segmentation analysis, including type, application, and regional outlook, provides insights into market share distribution and growth potential.
Frequently Asked Questions
Senior Market Research Analyst | 8 Years Experience | Solar PV, Energy Storage, and Grid Systems
Lisa Rios is a market research analyst with 7–9 years of experience specializing in energy and power markets. Contributed to 70+ research reports for global clients. Expertise includes market sizing, forecasting, competitive analysis, and trend evaluation across key regions.