Asia Pacific B2B Fuel Cards Market Size
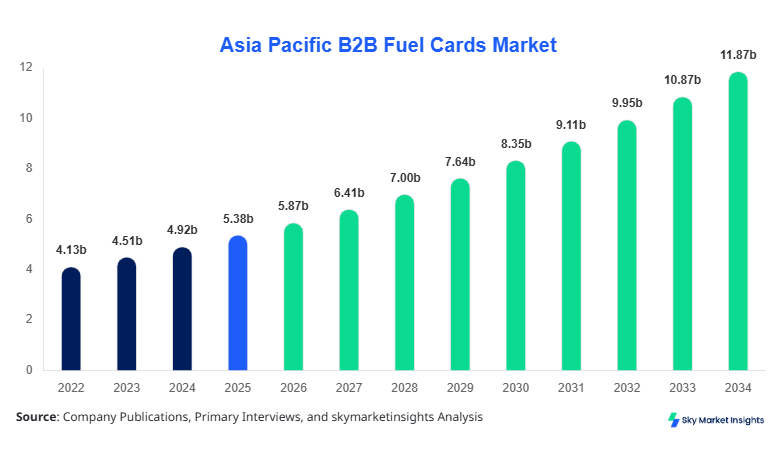
Asia Pacific B2B Fuel Cards Market market size is projected at USD 5.87 billion in 2026 and is expected to hit USD 11.92 billion by 2034 with a CAGR of 9.2%.” The Asia Pacific B2B Fuel Cards Market has been expanding steadily due to rising commercial fleet operations exceeding 42 million vehicles in 2025, coupled with increasing fuel expenditure tracking needs across enterprises. With over 68% of fleet operators adopting digital payment systems and more than 52% of transactions shifting toward card-based fuel payments, the Asia Pacific B2B Fuel Cards Market size reflects growing digitalization and operational efficiency demands. Increasing segmentation by fuel type, transaction frequency exceeding 18 transactions per card per month, and integration with telematics solutions further emphasize the need for detailed analytics and competitive landscape evaluation within the Asia Pacific B2B Fuel Cards Market.
The Asia Pacific B2B Fuel Cards Market refers to the ecosystem of payment solutions designed for commercial enterprises to manage fuel expenses across fleets, logistics operations, and corporate vehicles, enabling real-time tracking, cost optimization, and fraud prevention. In 2025, the Asia Pacific region recorded over 1.8 billion fuel card transactions, with India, China, and Japan contributing more than 72% of total transaction volume. Adoption and penetration insights indicate that nearly 64% of medium and large enterprises have integrated fuel cards into fleet management systems, while small businesses account for approximately 28% penetration due to cost sensitivity and infrastructure gaps. Consumer behavior and demand analytics highlight that 59% of fleet operators prioritize cost control and reporting efficiency, while 46% emphasize fraud prevention and driver accountability. Branded fuel cards contribute nearly 41% of the total market, universal fuel cards account for 34%, and merchant-specific cards represent 25%. The average transaction frequency ranges between 15–22 uses per vehicle per month, with fuel cards integrated into GPS and telematics systems in over 48% of fleets. Application-wise, logistics and transportation dominate with 49% share, followed by fleet management at 32% and corporate vehicles at 19%, reinforcing the expansion of the Asia Pacific B2B Fuel Cards Market.
In the India, the B2B Fuel Cards Market has witnessed significant expansion driven by over 12.6 million commercial vehicles and more than 185,000 logistics companies actively operating across the country. India accounts for approximately 27% of the Asia Pacific B2B Fuel Cards Market share, supported by increasing digital payment adoption, which has reached 71% among organized fleet operators. Fleet management applications dominate with 38% share, followed by logistics and transportation at 44% and corporate vehicle usage at 18%. More than 62% of enterprises in India have adopted telematics-enabled fuel card systems, while fuel consumption monitoring accuracy has improved by nearly 35% through digital integration. Additionally, over 2.3 billion liters of fuel purchases annually are processed through fuel cards in India, indicating strong transaction volumes. The presence of major oil marketing companies and fintech integrations has further accelerated adoption, reinforcing the dominance of the Asia Pacific B2B Fuel Cards Market.
Explore more data points, trends and opportunities Download Free Sample Report
B2B Fuel Cards Market Trends
Digital Integration and Telematics Expansion
The Asia Pacific B2B Fuel Cards Market is experiencing a strong shift toward digital integration, with over 54% of fuel cards now connected to telematics and fleet management platforms. In 2025, more than 980 million fuel card transactions were processed through integrated systems, enabling real-time monitoring of fuel consumption, route optimization, and driver behavior. The adoption of AI-based analytics has improved operational efficiency by 28%, while fraud detection rates have increased by 33%. Additionally, mobile-based fuel card management applications have seen a 61% adoption rate among fleet managers, reflecting the growing demand for digital convenience and automation in the Asia Pacific B2B Fuel Cards Market.
Contactless Payments and Security Enhancements
Contactless payment technologies have gained traction, accounting for nearly 47% of fuel card transactions across the region in 2025. With the implementation of EMV chip technology and tokenization, fraud incidents have decreased by approximately 26%, while transaction processing time has been reduced by 18%. Over 72% of new fuel cards issued in Asia Pacific now support contactless payments, enhancing convenience for drivers and fleet operators. Furthermore, biometric authentication and PIN-based security systems have been adopted by 39% of enterprises, contributing to secure transactions and reinforcing the technological advancement of the Asia Pacific B2B Fuel Cards Market.
Expansion of Multi-Fuel and EV Integration
The integration of multi-fuel options, including electric vehicle (EV) charging payments, has emerged as a key trend in the Asia Pacific B2B Fuel Cards Market. Nearly 22% of fuel cards now support EV charging payments, with EV fleet adoption increasing by 31% year-over-year. Hydrogen fuel and alternative energy integrations are also being explored, with pilot programs accounting for 6% of total card transactions. This shift toward sustainable energy solutions reflects the evolving energy landscape and growing environmental regulations, strengthening the long-term relevance of the Asia Pacific B2B Fuel Cards Market.
B2B Fuel Cards Market Driver
Increasing Fleet Digitalization and Cost Optimization Driving Asia Pacific B2B Fuel Cards Market Growth
The rapid digitalization of fleet operations and the need for cost optimization are key drivers of the Asia Pacific B2B Fuel Cards Market Growth. With over 42 million commercial vehicles operating across the region and fuel expenses accounting for nearly 38% of total fleet operating costs, enterprises are increasingly adopting fuel cards to enhance transparency and efficiency. Approximately 64% of fleet operators have reported cost savings of up to 18% through fuel card adoption, while administrative overheads have been reduced by 25%. The integration of analytics tools has enabled companies to monitor fuel usage patterns, resulting in a 21% improvement in fuel efficiency. Additionally, regulatory mandates promoting digital payments have accelerated adoption, with digital transaction volumes growing by 34% annually. The rise in cross-border logistics, contributing to over 19% of regional trade, further emphasizes the need for standardized fuel payment systems, reinforcing the Asia Pacific B2B Fuel Cards Market Growth.
B2B Fuel Cards Market Restraint
Limited Adoption Among Small Enterprises and Infrastructure Gaps
Despite strong growth, the Asia Pacific B2B Fuel Cards Market faces challenges due to limited adoption among small and medium enterprises (SMEs) and infrastructure gaps. SMEs, which account for nearly 52% of businesses in the region, exhibit only 28% adoption of fuel card solutions due to cost concerns and lack of awareness. Additionally, rural areas and underdeveloped regions have limited fuel station networks supporting card-based payments, affecting approximately 23% of potential users. Technical limitations, including connectivity issues and lack of integration with legacy systems, impact nearly 17% of enterprises. Furthermore, the initial setup cost, ranging between USD 500 to USD 2,000 per fleet, acts as a barrier for smaller operators. These factors collectively restrain the overall expansion of the Asia Pacific B2B Fuel Cards Market.
B2B Fuel Cards Market Opportunity
Expansion into Electric Vehicle Ecosystem and Cross-Border Transactions
The growing adoption of electric vehicles and cross-border logistics presents significant opportunities for the Asia Pacific B2B Fuel Cards Market. EV adoption in commercial fleets has increased by 31% annually, with over 4.2 million EVs expected to be integrated into fleet operations by 2030. Fuel cards supporting EV charging payments are projected to grow at a rate of 22% annually, creating new revenue streams for providers. Additionally, cross-border trade within Asia Pacific accounts for nearly USD 3.4 trillion, with logistics companies requiring unified payment solutions for fuel purchases across countries. Approximately 41% of logistics firms have expressed interest in multi-currency fuel cards, highlighting the potential for expansion. These opportunities are expected to drive innovation and diversification within the Asia Pacific B2B Fuel Cards Market.
B2B Fuel Cards Market Challenge
Data Security Concerns and Regulatory Compliance Complexity
Data security and regulatory compliance remain critical challenges in the Asia Pacific B2B Fuel Cards Market. With over 1.8 billion transactions processed annually, the risk of cyberattacks and data breaches has increased, impacting approximately 14% of enterprises. Compliance with varying regulations across countries, including data protection laws and financial transaction standards, adds complexity to operations. Nearly 37% of fuel card providers report challenges in maintaining compliance across multiple jurisdictions. Additionally, the cost of implementing advanced security measures, such as encryption and tokenization, has increased operational expenses by 12–15%. These challenges necessitate continuous investment in cybersecurity and regulatory frameworks, impacting the growth trajectory of the Asia Pacific B2B Fuel Cards Market.
Report Scope
| Report Metric | Details |
|---|---|
| Market Size in 2025 | USD 5.38 billion |
| Market Size in 2026 | USD 5.87 billion |
| Market Size in 2034 | USD 11.92 billion |
| CAGR | 9.2% (2026-2034) |
| Base Year for Estimation | 2025 |
| Historical Data | 2022-2024 |
| Forecast Period | 2026-2034 |
| Report Coverage | Revenue Forecast, Competitive Landscape, Supply Chain Disruption, Growth Factors, Environment & Regulatory Landscape and Trends |
Explore more data points, trends and opportunities Download Free Sample Report
B2B Fuel Cards Market Segmentation
The Asia Pacific B2B Fuel Cards Market is segmented by type and application, with branded fuel cards dominating at 41%, followed by universal fuel cards at 34% and merchant-specific cards at 25%. Application-wise, logistics and transportation lead with 49%, fleet management accounts for 32%, and corporate vehicles contribute 19%.
By Type
Branded fuel cards hold approximately 41% of the Asia Pacific B2B Fuel Cards Market share, with over 720 million cards issued across the region. These cards are typically issued by oil companies and are accepted at specific fuel station networks, covering more than 68% of fuel outlets. The average transaction volume per card exceeds 19 transactions per month, with fuel consumption tracking accuracy reaching 92%. These cards offer discounts of up to 6% on fuel purchases and are integrated with loyalty programs, contributing to their widespread adoption.
Universal fuel cards account for 34% of the market, with over 580 million active cards in circulation. These cards are accepted across multiple fuel station networks, covering nearly 82% of fuel outlets in the region. Transaction frequency averages 21 uses per month, while integration with telematics systems reaches 57%. These cards provide enhanced flexibility and are preferred by large logistics companies operating across multiple regions.
Merchant-specific fuel cards represent 25% of the market, with approximately 420 million cards issued. These cards are limited to specific merchant networks, covering around 45% of fuel stations. Transaction frequency averages 14 uses per month, with discounts ranging between 3–5%. These cards are primarily used by small and medium enterprises due to lower costs and localized operations.
By Application
Fleet management accounts for 32% of the Asia Pacific B2B Fuel Cards Market, with over 540 million transactions annually. Fuel cards enable real-time monitoring of fuel consumption, improving efficiency by 23% and reducing fuel theft by 31%. Integration with GPS systems has reached 62%, enhancing route optimization and cost control.
Logistics and transportation dominate with 49% share, processing over 920 million transactions annually. Fuel cards are essential for long-haul operations, enabling seamless payments across multiple regions. Adoption rates exceed 71% among large logistics firms, with fuel cost savings reaching up to 18%.
Corporate vehicles account for 19% of the market, with approximately 340 million transactions annually. Fuel cards are used for employee expense management, reducing administrative costs by 21% and improving reporting accuracy by 27%.
Asia Pacific B2B Fuel Cards Market Segmentations
Type
- Branded Fuel Cards
- Universal Fuel Cards
- Merchant Fuel Cards
Application
- Fleet Management
- Logistics & Transportation
- Corporate Vehicles
B2B Fuel Cards Market Regional Outlook
China
China holds approximately 29% of the Asia Pacific B2B Fuel Cards Market, with over 620 million transactions annually. The country’s logistics sector contributes nearly 52% of demand, supported by over 10 million commercial vehicles. Digital payment adoption exceeds 76%, driving market expansion.
South Korea
South Korea accounts for 9% of the market, with high adoption of contactless payments reaching 81%. The country processes over 180 million transactions annually, with fleet management applications dominating.
Japan
Japan contributes 14% of the market, with advanced telematics integration reaching 68%. The country processes approximately 260 million transactions annually, driven by corporate vehicle usage.
India
India holds 27% share, with over 2.3 billion liters of fuel purchased through fuel cards annually, supported by rapid digitalization.
Australia
Australia accounts for 8% of the market, with high adoption in mining and logistics sectors, processing over 150 million transactions annually.
Singapore
Singapore contributes 5% share, with 92% digital payment adoption and strong integration with fintech solutions.
Taiwan
Taiwan holds 4% share, with growing adoption in industrial logistics and fleet management.
South East Asia
South East Asia collectively accounts for 4%, with emerging markets showing adoption growth of 12% annually.
List of Top B2B Fuel Cards Companies
- Shell
- BP
- ExxonMobil
- WEX Inc.
- FleetCor Technologies
- Indian Oil Corporation
- HPCL
- Bharat Petroleum
- Caltex
- TotalEnergies
- U.S. Bank Voyager
- DKV Euro Service
Top Two Companies
-
FleetCor Technologies
-
Holds approximately 18% market share
-
Strong presence across 30+ countries
-
Processes over 1.2 billion transactions annually
-
Focus on digital payment integration
-
-
WEX Inc.
-
Accounts for nearly 14% share
-
Serves over 600,000 customers globally
-
Processes more than 900 million transactions annually
-
Strong analytics and reporting capabilities
-
INVESTMENT ANALYSIS AND OPPORTUNITIES
Investment in the Asia Pacific B2B Fuel Cards Market has increased by 21% annually, with over USD 1.4 billion allocated in 2025. Technology integration accounts for 38% of investments, followed by infrastructure expansion at 27% and security enhancements at 19%. Regional investment distribution shows India and China leading with 56% combined share.
M&A activity has intensified, with over 18 acquisitions recorded between 2023–2025. Strategic partnerships between oil companies and fintech firms account for 42% of collaborations, enabling digital payment innovations and cross-border solutions.
NEW PRODUCT DEVELOPMENT
New product development accounts for 17% of total market activity, with over 120 new fuel card solutions launched in 2025. Performance improvements include 28% faster transaction processing and 33% enhanced security features. EV-compatible fuel cards have increased by 22%, reflecting the shift toward sustainable energy.
RECENT DEVELOPMENTS
- 2025: FleetCor expanded operations in Asia Pacific, increasing transaction volume by 19%
Frequently Asked Questions
Senior Market Research Analyst | 9 Years Experience | Freight Logistics, Multimodal Transportation, and Supply Chain Digitization
Mary specializes in data-driven market intelligence across freight logistics, multimodal transportation networks, and end-to-end supply chain digitization platforms, including TMS and real-time visibility solutions. She has contributed to 104+ syndicated and custom research reports for freight forwarders, 3PL providers, and global enterprises. Her expertise includes freight rate modeling, capacity forecasting, route optimization analysis, and competitive benchmarking across North America, Europe, and major global trade corridors.