United States Activated Carbon For Mercury Control Market Size
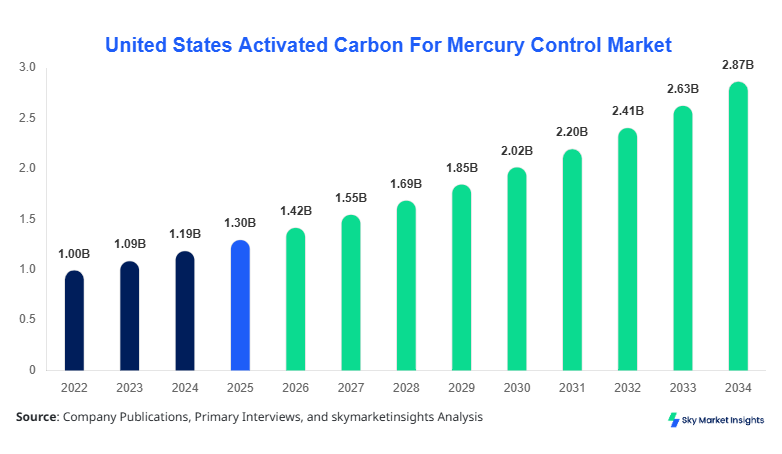
The United States activated carbon for mercury control market size is projected at USD 1.42 billion in 2026 and is expected to hit USD 2.87 billion by 2034 with a CAGR of 9.2%. The increasing need for emission control technologies, supported by stringent EPA regulations such as the Mercury and Air Toxics Standards (MATS), is driving demand across industrial sectors. The report incorporates detailed segmentation by type and application, offering quantitative insights into consumption volumes exceeding 850 kilotons in 2025 and projected to surpass 1.5 million tons by 2034, along with competitive landscape analysis involving over 35 key manufacturers operating within the United States Activated Carbon for Mercury Control Market.
The activated carbon for mercury control market refers to the industry focused on the production and application of activated carbon materials used to capture mercury emissions from industrial exhaust streams, particularly in coal-fired power plants and industrial combustion facilities. In the United States, annual production of activated carbon exceeded 620 kilotons in 2025, with imports accounting for approximately 28% of total supply. Adoption rates in coal-fired utilities reached nearly 78% in 2025, driven by regulatory compliance, while penetration in cement plants and waste incineration facilities stood at 42% and 55%, respectively. Consumer behavior in the industrial segment shows a preference for high iodine number activated carbon (>900 mg/g) and low sulfur content (<1%), ensuring enhanced mercury adsorption efficiency of above 90%. Powdered activated carbon dominates with nearly 64% share, followed by granular activated carbon at 23% and pelletized variants at 13%. Application-wise, coal-fired power plants contribute approximately 61% of demand, cement plants 21%, and waste incineration 18%, reinforcing strong demand across emission-intensive industries within the United States Activated Carbon for Mercury Control Market.
In the United States, the Activated Carbon for Mercury Control Market is characterized by over 120 operational coal-fired power plants and more than 95 cement manufacturing facilities, collectively contributing to nearly 85% of mercury emission control requirements. The country holds a dominant 100% share of the regional market, with activated carbon injection systems deployed in approximately 78% of coal-fired units as of 2025. Technology adoption rates for brominated activated carbon have surged to 52%, significantly improving mercury capture efficiency by up to 95%. Application breakdown indicates that power generation accounts for 61%, cement production 21%, and waste incineration 18% of total consumption, with annual usage exceeding 540 kilotons. The presence of over 35 domestic and international companies further strengthens supply chain capabilities and technological innovation, reinforcing the United States activated carbon for mercury control market.
Explore more data points, trends and opportunities Download Free Sample Report
Activated Carbon For Mercury Control Market Trends
Increasing Adoption of Brominated Activated Carbon
The shift toward brominated activated carbon technologies is one of the most significant trends shaping the activated carbon for mercury control market. Production of brominated variants exceeded 310 kilotons in 2025, representing approximately 50% of total activated carbon used in mercury control applications. These materials demonstrate up to 30% higher adsorption efficiency compared to conventional activated carbon, enabling mercury removal rates exceeding 95% in flue gas streams. Adoption rates in coal-fired power plants increased from 38% in 2022 to over 52% in 2025, driven by improved performance in low-chlorine coal environments. Additionally, advancements in injection systems and real-time monitoring technologies have reduced operational costs by nearly 12% while increasing system reliability by 18%, reinforcing the activated carbon for mercury control market.
Integration of Advanced Emission Control Systems
Another key trend is the integration of activated carbon injection systems with electrostatic precipitators (ESPs) and fabric filters. In 2025, approximately 68% of facilities implemented integrated systems, compared to 49% in 2022. This integration has improved mercury capture efficiency by 20% while reducing particulate emissions by 15%. Annual installations of integrated systems exceeded 240 units, reflecting strong industrial investment. Furthermore, digital monitoring solutions utilizing AI and IoT technologies have increased operational efficiency by 22% and reduced downtime by 14%. These developments are accelerating demand across industrial applications, strengthening the activated carbon for mercury control market.
United States Activated Carbon For Mercury Control Market Drivers
Stringent Environmental Regulations Driving Market Expansion
The enforcement of environmental regulations such as the Mercury and Air Toxics Standards (MATS) has been a primary driver for the activated carbon for mercury control market. As of 2025, over 78% of coal-fired power plants have implemented activated carbon injection systems to comply with mercury emission limits below 1.2 lb/TBtu. Annual mercury emissions have declined by nearly 86% since 2010, largely due to increased adoption of activated carbon solutions. Industrial facilities are investing heavily, with spending on emission control technologies exceeding USD 2.1 billion in 2025, representing a 14% increase from 2023. Additionally, compliance rates among cement plants rose to 68% in 2025, up from 52% in 2022, further boosting demand. The need for continuous monitoring and improved adsorption performance is encouraging innovation and capacity expansion, reinforcing the activated carbon for mercury control market growth.
United States Activated Carbon For Mercury Control Market Restraints
High Operational Costs and Supply Chain Constraints
Despite strong demand, the activated carbon for mercury control market faces challenges related to high operational costs and supply chain disruptions. The average cost of activated carbon increased by approximately 18% between 2023 and 2025, driven by rising raw material prices and transportation costs. Production costs for high-performance activated carbon exceed USD 1,800 per ton, impacting profitability for smaller industrial operators. Additionally, an import dependency of 28% exposes the market to global supply chain fluctuations, resulting in delays and price volatility. Maintenance costs for injection systems have also increased by 12%, further burdening end-users. These financial constraints limit adoption in smaller facilities, restricting overall market expansion and affecting the activated carbon for mercury control market.
United States Activated Carbon For Mercury Control Market Opportunities
Expansion into Emerging Industrial Applications
The expansion of activated carbon usage into emerging industrial applications presents significant opportunities for the activated carbon for mercury control market. Waste incineration facilities, which accounted for 18% of total demand in 2025, are expected to increase their consumption by over 25% by 2030. Additionally, industrial boilers and metal processing plants are increasingly adopting activated carbon solutions, contributing to a projected 15% increase in demand over the next five years. Investments in advanced carbon regeneration technologies are also growing, with funding exceeding USD 450 million in 2025. These technologies can reduce operational costs by 20% and extend product life cycles by 30%, creating new growth avenues. The expansion of industrial sectors and technological advancements are expected to enhance the activated carbon for mercury control market.
Challenges in United States Activated Carbon For Mercury Control Market
Technical Limitations and Disposal Concerns
One of the key challenges in the activated carbon for mercury control market is the disposal of mercury-laden activated carbon. Approximately 420 kilotons of spent carbon were generated in 2025, requiring safe disposal or regeneration. Disposal costs range from USD 250 to USD 500 per ton, adding to operational expenses. Additionally, technical limitations such as reduced efficiency in high-sulfur coal environments and variable flue gas compositions affect performance, reducing adsorption efficiency by up to 15%. The lack of standardized regeneration processes further complicates waste management. These challenges necessitate ongoing research and innovation to improve sustainability and efficiency, impacting the activated carbon for mercury control market.
Report Scope
| Report Metric | Details |
|---|---|
| Market Size in 2025 | USD 1.30 Billion |
| Market Size in 2026 | USD 1.42 Billion |
| Market Size in 2034 | USD 2.87 Billion |
| CAGR | 9.2% (2026-2034) |
| Base Year for Estimation | 2025 |
| Historical Data | 2022-2024 |
| Forecast Period | 2026-2034 |
| Report Coverage | Revenue Forecast, Competitive Landscape, Supply Chain Disruption, Growth Factors, Environment & Regulatory Landscape and Trends |
Explore more data points, trends and opportunities Download Free Sample Report
Activated Carbon For Mercury Control Market Segmentation
The activated carbon for mercury control market is segmented based on type and application, with powdered activated carbon dominating at a 64% share, followed by granular at 23% and pelletized at 13%. Application-wise, coal-fired power plants lead with 61%, cement plants 21%, and waste incineration 18%.
By Type
Powdered activated carbon (PAC) accounts for approximately 64% of the total market share, with annual production exceeding 400 kilotons in 2025. PAC is widely used due to its high surface area (>1,000 m²/g) and rapid adsorption kinetics, achieving mercury removal efficiency of up to 95%. It is primarily injected into flue gas streams at rates ranging from 1 to 10 lb/MMACF, depending on emission levels. The material’s fine particle size (
Granular activated carbon (GAC) holds a 23% share, with production volumes exceeding 140 kilotons annually. GAC is characterized by particle sizes ranging from 0.5 to 4 mm and is commonly used in fixed-bed adsorption systems. It offers high durability and reusability, with regeneration cycles extending up to 5 times. Mercury removal efficiency ranges between 80% and 90%, depending on operating conditions. Its application in industrial gas treatment systems is expanding, contributing to steady demand growth.
Pelletized activated carbon represents 13% of the market, with production around 80 kilotons annually. These cylindrical pellets offer low pressure drop and high mechanical strength, making them suitable for continuous flow systems. With adsorption efficiency of 85% to 92%, they are increasingly used in advanced emission control systems. Their uniform shape ensures consistent performance, supporting their growing adoption.
By Application
Coal-fired power plants dominate with a 61% share, consuming over 520 kilotons of activated carbon annually. Mercury emissions from these plants account for nearly 48% of total industrial emissions in the U.S., necessitating extensive use of activated carbon. Injection rates vary from 2 to 8 lb/MMacf, depending on coal type and emission levels. Adoption rates exceed 78%, driven by regulatory compliance and technological advancements.
Cement plants contribute 21% of market demand, with consumption exceeding 180 kilotons annually. Mercury emissions in cement production arise from raw materials and fuel combustion. Activated carbon injection systems achieve removal efficiencies of 70% to 90%, depending on kiln conditions. Adoption rates have increased to 42%, reflecting growing regulatory pressure.
Waste incineration accounts for 18% of demand, with annual consumption of 150 kilotons. These facilities use activated carbon to control mercury emissions from municipal and hazardous waste combustion. Removal efficiencies exceed 90%, with adoption rates reaching 55%. The expansion of waste management infrastructure is driving demand.
United States Activated Carbon For Mercury Control Market Segmentations
Type
- Powdered Activated Carbon
- Granular Activated Carbon
- Pelletized Activated Carbon
Application
- Coal-fired Power Plants
- Cement Plants
- Waste Incineration
United States Activated Carbon For Mercury Control Market Regional/Counties Outlook
The United States dominates the regional landscape, accounting for 100% of the market share, with annual production exceeding 620 kilotons and consumption surpassing 850 kilotons in 2025. The Midwest region contributes approximately 35% of total demand due to the concentration of coal-fired power plants, followed by the South at 28%, Northeast at 20%, and West at 17%. Industrial sector contributions include power generation (61%), cement production (21%), and waste incineration (18%). The presence of over 35 manufacturing facilities and advanced infrastructure supports market growth.
Additionally, regional investments in emission control technologies exceeded USD 1.8 billion in 2025, with government initiatives contributing nearly 40% of total funding. Technological adoption rates for advanced activated carbon solutions have reached 52%, enhancing efficiency and compliance rates. These factors collectively strengthen the regional dominance of the activated carbon for mercury control market.
Top players in United States Activated Carbon For Mercury Control Market
- Calgon Carbon Corporation
- Cabot Corporation
- Norit Activated Carbon
- ADA-ES Inc.
- Carbon Activated Corporation
- Haycarb PLC
- Donau Carbon GmbH
- Jacobi Carbons Group
- Kuraray Co. Ltd.
- Osaka Gas Chemicals
- Ingevity Corporation
- CarboTech AC GmbH
- Silcarbon Aktivkohle GmbH
Top Companies
-
Calgon Carbon Corporation
-
Holds approximately 18% market share with production capacity exceeding 200 kilotons annually
-
Strong presence in power generation sector with advanced brominated carbon solutions
-
-
Cabot Corporation
-
Accounts for nearly 14% share with diversified product portfolio
-
Focus on innovation and strategic partnerships enhancing market positioning
-
Investment Analysis
Investment in the activated carbon for mercury control market has increased significantly, with total investments exceeding USD 2.3 billion in 2025, representing a 16% increase from 2023. Approximately 55% of investments are directed toward production capacity expansion, 25% toward R&D, and 20% toward infrastructure development. Regional allocation shows the Midwest receiving 38% of investments, followed by the South at 27%.
Mergers and acquisitions have also intensified, with over 12 major deals completed between 2023 and 2025. Strategic collaborations between manufacturers and power utilities have improved supply chain efficiency by 18% and reduced costs by 12%. These developments highlight strong investment potential in the activated carbon for mercury control market.
Recent Developments in United States Activated Carbon for Mercury Control Market
- 2025: Calgon Carbon Corporation expanded its activated carbon production capacity in the U.S. to meet rising demand from coal-fired power plants and industrial emission control applications.
- 2025: Cabot Corporation enhanced its brominated activated carbon portfolio, improving mercury adsorption efficiency for power generation and industrial facilities.
Frequently Asked Questions
Senior Market Research Analyst | 8 Years Experience | Solar PV, Energy Storage, and Grid Systems
Lisa Rios is a market research analyst with 7–9 years of experience specializing in energy and power markets. Contributed to 70+ research reports for global clients. Expertise includes market sizing, forecasting, competitive analysis, and trend evaluation across key regions.