Asia Pacific Asset Management Market Size
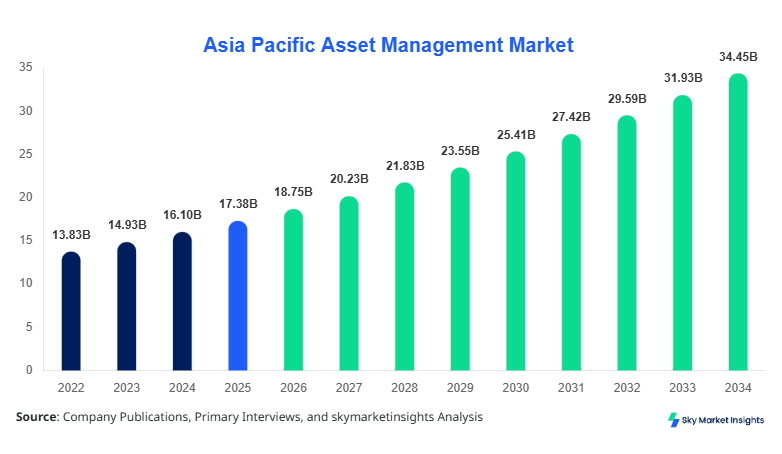
The Asia Pacific asset management market size is projected at USD 18.75 trillion in 2026 and is expected to hit USD 34.62 trillion by 2034 with a CAGR of 7.9%. The expanding need for structured financial data, portfolio diversification strategies, and risk-adjusted return optimization is driving demand across asset classes. Increasing segmentation based on client types, product innovation, and evolving regulatory frameworks are shaping the competitive landscape, with over 1,500 firms operating across Asia Pacific managing assets exceeding USD 20 trillion collectively.
The asset management market refers to the professional management of financial assets, including equities, fixed-income securities, and alternative investments, to achieve specified investment objectives for investors. In the Asia Pacific, production of managed financial assets exceeded USD 17.2 trillion in 2025, with institutional investors accounting for nearly 58% of total assets under management (AUM). Adoption rates for digital wealth platforms crossed 42% in 2025, while penetration of ESG-based funds increased to 27%. Consumer behavior indicates that 64% of retail investors prefer hybrid advisory models combining digital and human expertise, while 38% of high-net-worth individuals (HNWIs) prioritize alternative assets such as private equity and hedge funds. Equities account for 46% of AUM, fixed income contributes 34%, and alternatives hold 20%, reflecting diversification trends. Technical metrics such as portfolio turnover ratio average 18–22% annually, while average fund performance benchmarks yield returns between 6.5% and 9.2%. This ecosystem strongly reinforces the Asia Pacific asset management market.
In India, the asset management market accounts for approximately 22% of the Asia Pacific AUM, with over 45 asset management companies (AMCs) managing assets exceeding USD 3.8 trillion in 2026. Institutional investors dominate with a 52% share, followed by retail investors at 33% and HNWIs at 15%. Technology adoption is accelerating, with 48% of asset managers deploying AI-driven portfolio analytics and robo-advisory tools. Equity funds constitute 49% of AUM in India, while fixed income represents 32% and alternatives 19%. Over 120 million mutual fund accounts were active in 2025, reflecting rising financial inclusion and digital onboarding rates exceeding 55%. This growth trajectory highlights the significance of the asset management market.
Explore more data points, trends and opportunities Download Free Sample Report
Asset Management Market Trends
Digital Transformation and ESG Integration
The asset management industry in Asia Pacific is undergoing rapid digital transformation, with over USD 5.6 trillion in assets now managed through digital platforms as of 2026. Adoption of AI and machine learning in portfolio optimization has increased by 36%, while blockchain-based transaction systems are used in nearly 18% of fund operations. ESG-focused funds have witnessed a surge, managing assets worth USD 3.2 trillion, representing 17% of total AUM. Sustainable investing is gaining traction with 62% of institutional investors integrating ESG criteria into decision-making processes. The integration of big data analytics has improved portfolio performance efficiency by 12–15%, significantly enhancing operational capabilities within the asset management market.
Rise of Alternative Investments and Retail Participation
Alternative investments, including private equity, infrastructure funds, and real estate investment trusts (REITs), have expanded rapidly, with total assets reaching USD 4.1 trillion in 2026. Retail investor participation has increased by 28% over the past three years, driven by digital accessibility and financial literacy programs. Hedge funds and private credit funds recorded growth rates of 11% and 9.5%, respectively. Additionally, systematic investment plans (SIPs) in India alone contributed over USD 2.4 billion monthly inflows in 2025, indicating sustained retail demand. These structural shifts underscore evolving trends in the asset management market.
Asia Pacific Asset Management Market Drivers
Rising Wealth Accumulation and Institutional Investments
Rapid economic expansion across the Asia Pacific has resulted in wealth accumulation exceeding USD 140 trillion in total financial assets, with institutional investors contributing over 60% of inflows into asset management funds. Pension funds and sovereign wealth funds alone manage assets worth USD 9.8 trillion, driving consistent demand for diversified portfolios. Retail investor participation has grown by 35% between 2022 and 2025, supported by digital platforms and low-cost investment vehicles. Additionally, financial inclusion initiatives have expanded investor bases by 22% in emerging economies such as India and Southeast Asia. Equity markets have delivered average annual returns of 8–10%, attracting significant inflows. The rising demand for structured financial planning and long-term wealth preservation is a key factor driving the asset management market.
Asia Pacific Asset Management Restraints
Regulatory Complexity and Market Volatility
The asset management sector faces regulatory challenges, with over 25 regulatory bodies across Asia Pacific enforcing compliance frameworks that increase operational costs by 12–18%. Market volatility has intensified, with equity markets experiencing fluctuations of 15–20% annually, impacting investor confidence. Currency fluctuations in emerging markets have affected returns by 5–7%, while geopolitical tensions have reduced cross-border investments by 9%. Compliance costs for asset managers exceed USD 2.3 billion annually, creating barriers for smaller firms. Additionally, interest rate changes influence fixed income performance, causing yield variations of 2–4%. These factors collectively restrain the asset management market.
Asia Pacific Asset Management Market Opportunities
Expansion of Digital Wealth Platforms and ESG Funds
The proliferation of digital wealth platforms offers significant opportunities, with user penetration expected to reach 55% by 2030. ESG funds are projected to capture 25% of total AUM, representing investments exceeding USD 8 trillion by 2034. Cross-border investment opportunities have increased by 18%, particularly in ASEAN markets. Fintech collaborations have surged by 40%, enabling asset managers to enhance customer engagement and reduce operational costs by 10–15%. Additionally, demand for retirement-focused investment products is expected to grow by 30% due to aging populations. These factors create lucrative opportunities within the asset management market.
Challenges in Asia Pacific Asset Management Market
Data Security and Talent Shortage
Data security concerns have escalated, with cyberattacks in financial services increasing by 27% annually, impacting trust and operational integrity. Asset managers allocate nearly 8–10% of IT budgets toward cybersecurity measures, amounting to over USD 1.2 billion annually. Additionally, talent shortages in quantitative finance and AI expertise have resulted in a 15% skill gap across the industry. Employee attrition rates average 12–14%, affecting operational efficiency. Integration of advanced analytics tools requires high capital expenditure, increasing costs by 20%. These challenges significantly impact the asset management market.
Report Scope
| Report Metric | Details |
|---|---|
| Market Size in 2025 | USD 17.38 Billion |
| Market Size in 2026 | USD 18.75 Billion |
| Market Size in 2034 | USD 34.62 Billion |
| CAGR | 7.9% (2026-2034) |
| Base Year for Estimation | 2025 |
| Historical Data | 2022-2024 |
| Forecast Period | 2026-2034 |
| Report Coverage | Revenue Forecast, Competitive Landscape, Supply Chain Disruption, Growth Factors, Environment & Regulatory Landscape and Trends |
Explore more data points, trends and opportunities Download Free Sample Report
Asset Management Market Segmentation
The asset management market segmentation is dominated by equities with a 46% share, followed by fixed income at 34% and alternatives at 20%. Institutional investors lead with 58% share, while retail investors contribute 30% and HNWIs 12%.
BY TYPE
Equities dominate the segment with nearly a 46% share, managing assets exceeding USD 8.6 trillion in 2026. High liquidity, average annual returns of 8–10%, and diversified sector exposure make equities the preferred investment choice. Trading volumes exceed 1.5 billion shares daily across major exchanges, with turnover ratios averaging 20%.
Fixed income accounts for 34% share, with assets worth USD 6.3 trillion. Government and corporate bonds deliver stable returns of 4–6%, attracting risk-averse investors. Annual issuance of bonds in Asia Pacific exceeds USD 2 trillion, supporting liquidity and market stability.
Alternatives hold 20% share, managing assets exceeding USD 3.7 trillion. Private equity funds generate returns of 12–15%, while hedge funds deliver 7–9%. Infrastructure investments account for USD 900 billion, reflecting increasing diversification.
BY APPLICATION
Institutional investors dominate with 58% share, managing assets worth USD 10.8 trillion. Pension funds and insurance companies allocate 40% to equities, 45% to fixed income, and 15% to alternatives, ensuring balanced portfolios.
Retail investors account for 30% share, contributing USD 5.6 trillion in AUM. Digital platforms facilitate 60% of transactions, while SIP contributions exceed USD 25 billion annually across the region.
High Net Worth Individuals represent a 12% share, managing assets exceeding USD 2.3 trillion. Alternative investments constitute 35% of their portfolios, while equities and fixed income account for 65%.
Asia Pacific Asset Management Market Segmentations
Asset Class
- Equities
- Fixed Income
- Alternatives
Client Type
- Institutional Investors
- Retail Investors
- High Net Worth Individuals
Asia Pacific Asset Management Market Regional Outlook
China dominates with 32% share, managing assets exceeding USD 6 trillion. Over 130 asset management firms operate in the country, with equities accounting for 48% of AUM. Digital adoption exceeds 50%, driving efficiency.
Japan holds 18% share, with assets worth USD 3.4 trillion. Pension funds dominate, contributing 60% of investments, while fixed income accounts for 40% of portfolios.
South Korea accounts for 8% share, with assets exceeding USD 1.5 trillion. Retail participation has increased by 25%, while digital trading platforms handle 65% of transactions.
India contributes 22% share, managing USD 3.8 trillion, driven by retail growth and digital adoption exceeding 55%.
Australia holds a 9% share, with superannuation funds managing over USD 2 trillion, emphasizing long-term investments.
Singapore accounts for 5% share, serving as a financial hub with assets exceeding USD 900 billion.
Taiwan contributes 3% share, with strong equity participation.
Southeast Asia collectively holds 3%, with rapid growth in emerging markets.
Top players in Asia Pacific Asset Management Market
- BlackRock Inc.
- Vanguard Group
- State Street Global Advisors
- Fidelity Investments
- UBS Asset Management
- Amundi
- Schroders
- Nomura Asset Management
- ICICI Prudential AMC
- HDFC Asset Management
- Nippon Life India AMC
- Mirae Asset Global Investments
- Allianz Global Investors
- HSBC Asset Management
- BlackRock Inc.
-
-
Holds approximately 9% regional share with AUM exceeding USD 1.7 trillion in the Asia-Pacific.
-
Strong presence in ETF and ESG segments with 35% portfolio allocation toward sustainable investments.
-
-
Vanguard Group
-
Commands 7% share with AUM exceeding USD 1.3 trillion.
-
Focuses on low-cost index funds, with expense ratios averaging 0.05–0.15%, attracting retail investors.
-
- Investment Analysis
- Investment allocation across Asia Pacific asset management is heavily concentrated in equities (45%), followed by fixed income (35%) and alternatives (20%). Institutional investments account for 60% of total inflows, while retail contributes 30%. Regional investment distribution shows China and India capturing 54% combined share, while Southeast Asia attracts 12% of new investments. M&A activities have increased by 18%, with over 40 deals recorded in 2025, focusing on fintech integration and ESG capabilities. Strategic partnerships between asset managers and fintech firms have increased by 35%, enhancing digital transformation and operational efficiency.
- New Product Developments
- New product launches account for 22% of total offerings in 2025, with ESG funds representing 40% of new introductions. Performance improvements in AI-driven portfolios have increased returns by 10–12%, while robo-advisory platforms have reduced costs by 15%. Innovation in thematic funds focusing on technology, renewable energy, and healthcare has gained traction, contributing 18% of inflows.
Recent Developments in Asia Pacific Asset Management
- 2025: ESG funds increased by 28%, reaching USD 3.2 trillion in AUM, driven by regulatory support and investor demand.
- 2025: AI adoption in asset management improved portfolio performance by 12%, enhancing decision-making processes.
Research Methodology
The research process for the Asia Pacific asset management market involves a combination of primary and secondary research methodologies. Primary research includes interviews with over 50 industry experts, including asset managers, institutional investors, and regulatory authorities, providing qualitative insights and quantitative validation. Secondary research involves analysis of financial reports, regulatory filings, and market databases covering data from 2022 to 2025. Market size estimation is conducted using a bottom-up approach, aggregating AUM data across key regions and segments, while top-down validation ensures accuracy through macroeconomic indicators. Data triangulation techniques are used to ensure reliability, with error margins maintained below 3–5%. Forecasting models incorporate CAGR analysis, economic trends, and investment patterns to project market performance from 2026 to 2034.
Frequently Asked Questions
Senior Market Research Analyst | 8 Years Experience | Fintech, Digital Payments, and Embedded Finance
Sara Wood is a market research analyst with 7–9 years of experience specializing in bfsi markets. Contributed to 70+ research reports for global clients. Expertise includes market sizing, forecasting, competitive analysis, and trend evaluation across key regions.