United States Spinning Machinery Market Size
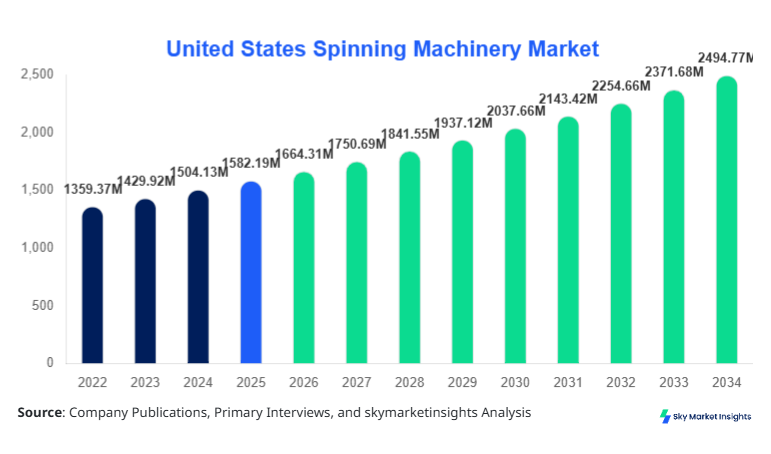
The United States Spinning Machinery market size is projected at USD 1,664.31 million in 2026 and is expected to hit USD 2,498.60 million by 2034 with a CAGR of 5.19%. The industry is moving toward digitally connected, energy-efficient, and automated yarn-production systems as mills address labor availability, quality consistency, and operating-cost pressures. Analysis of machine type, operation type, material, end use, spinning process, and sales channel provides the basis for evaluating demand patterns and the competitive landscape.
Key Takeaways
- Ring spinning machines dominate machine-type revenue at USD 590.10 million in 2026, representing approximately 35.46% of the total; air-jet spinning is the fastest-growing listed technology at a 5.36% CAGR.
- Automatic equipment dominates operation type at USD 766.85 million in 2026, equivalent to approximately 46.06%, and records the fastest CAGR of 5.50%.
- Air-jet spinning machines increase from USD 449.33 million in 2026 to USD 682.29 million by 2034, adding USD 232.96 million over the forecast period.
- Automatic machinery expands from USD 766.85 million to USD 1,176.87 million between 2026 and 2034, an absolute increase of USD 410.02 million.
- The U.S. forecast reaches USD 2,498.60 million by 2034, compared with USD 1,581.88 million in 2025, supported by automation, modernization and higher-productivity spinning systems.
The spinning machinery industry comprises equipment that converts natural, synthetic, and blended staple fibers into yarn through ring, rotor, air-jet, friction, and alternative spinning technologies. Based on the supplied dataset, 2026 machine-type revenue totals USD 1,664.31 million: ring machines contribute 35.46%, air-jets 27.00%, rotors 20.11%, friction 12.43%, and other technologies 5.01%. Automatic systems account for approximately 46.06% of operation-type revenue, compared with 32.29% for semi-automatic and 21.66% for manual systems. U.S. adoption increasingly centers on automation of piecing, doffing, material transport, quality monitoring, and packaging; advanced systems can automate as much as 85% of manual work in ring and compact spinning.
Explore more data points, trends and opportunities Download Free Sample Report
United States Spinning Machinery Market Trends
Automation and Digitization Reshape Yarn Production
Automation is shifting investment toward interconnected machinery, robotic material handling and digital production management. Rieter's automation roadmap targets spinning mills requiring only 3 skilled operators per 10,000 spindles per shift while producing approximately 1.9 tons of yarn, illustrating the scale of labor-productivity improvement achievable through automated transport, piecing and packaging. Its integrated ring and compact-spinning solutions can automate up to 85% of manual work.
United States Spinning Machinery Market Drivers
Labor Productivity and Mill Automation Accelerate Equipment Replacement
Labor constraints and the need for higher equipment utilization are accelerating investment in automatic machinery. Modern systems can automate approximately 85% of manual ring and compact-spinning work, while next-generation mill configurations target 3 operators per 10,000 spindles and output of around 1.9 tons of yarn per shift. Equipment upgrades can also deliver measurable productivity improvements; one documented compact-spinning conversion increased productivity by 7%. These operating gains strengthen the economics of replacing older machinery with digitally monitored systems.
United States Spinning Machinery Market Restraints
High Capital Costs and Rising Operating Expenses
High capital requirements for modern spinning machinery can restrain investment among U.S. textile manufacturers, particularly smaller mills operating under tight cost pressures. Advanced spinning systems increasingly incorporate automation, electronic controls, sensors, energy-management systems, and digital monitoring, raising the initial investment required for equipment replacement or capacity expansion. Operating economics also remain challenging: U.S. textile mills recorded a 3.4% increase in unit labor costs in 2025, while the unit labor-cost index reached 144.1, compared with 100 in 2017. Higher labor, energy, maintenance, and imported-component costs can lengthen machinery payback periods and encourage mills to extend the service life of existing equipment rather than undertake major modernization programs. These cost pressures can restrain capital expenditure and equipment replacement across the United States Spinning Machinery Market.
United States Spinning Machinery Market Opportunities
Smart Mills Create Opportunities for High-Efficiency Equipment
Integrated automation offers substantial scope for machinery suppliers as mills pursue lower energy consumption, fewer manual interventions and higher throughput. Advanced preparation equipment has achieved 800 kg/hour output while cutting energy requirements by 30% and compressed-air consumption by 63%. Automated spinning architectures capable of eliminating up to 85% of manual work further create opportunities across robotics, sensors, machine controls, predictive maintenance and automated material transport.
Challenges in United States Spinning Machinery Market
Skilled Labor Shortages and Competitive Manufacturing Costs
The availability of skilled personnel capable of operating, maintaining, and optimizing sophisticated spinning machinery remains a significant challenge for U.S. textile manufacturers. Modern spinning equipment requires technicians with expertise in automation, electronics, mechanical systems, process control, and data-driven production management, while the broader textile industry continues to face workforce shortages. Industry research identifies skilled-workforce shortages as a key challenge for textile automation, increasing pressure on manufacturers to invest simultaneously in machinery and employee training. At the same time, U.S. textile producers compete with lower-cost international manufacturing bases, making productivity and equipment utilization critical for maintaining competitiveness. Although textile and fabric finishing mills achieved a 16.1% productivity increase in 2025, uneven productivity performance across manufacturing highlights the need for continuous technological upgrading. These workforce and competitiveness pressures create an ongoing challenge for the United States Spinning Machinery Market.
Report Scope
| Report Metric | Details |
|---|---|
| Market Size in 2025 | USD 1582.20 Million |
| Market Size in 2026 | USD 1664.31 Million |
| Market Size in 2034 | USD 2498.6 Million |
| CAGR | 5.19% (2026-2034) |
| Base Year for Estimation | 2025 |
| Historical Data | 2022-2024 |
| Forecast Period | 2026-2034 |
| Report Coverage | Revenue Forecast, Competitive Landscape, Supply Chain Disruption, Growth Factors, Environment & Regulatory Landscape and Trends |
Explore more data points, trends and opportunities Download Free Sample Report
United States Spinning Machinery Market Segmentation
The industry is segmented by machine type, operation type, material type, end-use industry, spinning process and sales channel. Within quantified categories, ring spinning holds approximately 35.46% of 2026 machine-type revenue, while automatic equipment represents approximately 46.06% of operation-type revenue.
By Machine Type
Ring spinning machines are the largest machine category, increasing from USD 561.25 million in 2025 to USD 590.10 million in 2026 and USD 881.19 million by 2034, representing a 5.14% CAGR. Their 2026 contribution is approximately 35.46%, reflecting continued utilization for versatile, high-quality yarn production.
Air-jet machinery is the fastest-growing listed machine category at a 5.36% CAGR, expanding from USD 449.33 million in 2026 to USD 682.29 million by 2034. Rotor machinery follows at 5.22%, while friction and other technologies record 5.10% and 5.13%, respectively.
By Operation Type
Automatic machinery leads the category at USD 766.85 million in 2026 and is forecast to reach USD 1,176.87 million by 2034, registering a 5.50% CAGR. Its approximately 46.06% contribution highlights increasing preference for automated handling, monitoring and production control.
Automatic systems are also the fastest-growing operation type at 5.50%, compared with 5.12% for semi-automatic and 4.95% for manual equipment. Semi-automatic machinery reaches USD 801.58 million by 2034, while manual systems reach USD 530.73 million.
By Material Type
Natural fibers, synthetic fibers and blended fibers constitute the principal material categories. Quantified material-level revenue was not supplied; consequently, no unsupported market-size allocation is introduced. Machine-type data nevertheless shows USD 1,664.31 million of total 2026 equipment revenue and a 5.19% overall CAGR.
Material flexibility remains important because ring, rotor and air-jet technologies process different fiber specifications and blends. The overall quantified equipment base advances toward USD 2,498.60 million by 2034, representing approximately USD 834.29 million of additional revenue from the 2026 level.
By End-Use Industry
Apparel and fashion, home textiles, industrial textiles, medical textiles, automotive textiles and other applications constitute the end-use structure. End-use-specific values were not supplied; therefore, no fabricated dominance or CAGR is assigned. The quantified overall market progresses from USD 1,664.31 million in 2026 to USD 2,498.60 million in 2034.
Technology selection varies by required yarn strength, consistency, productivity and surface characteristics. Air-jet machinery's 5.36% CAGR and ring machinery's USD 590.10 million 2026 value demonstrate investment across both high-throughput and conventional quality-focused production.
By Spinning Process
Short-staple and long-staple spinning form the process segmentation. Process-specific monetary data was not provided, preventing defensible allocation of the USD 1,664.31 million 2026 total between the two categories.
Short-staple automation is nevertheless technologically significant: advanced configurations envision 3 skilled operators per 10,000 spindles while producing approximately 1.9 tons of yarn per shift. The supplied total industry CAGR remains 5.19%.
United States Spinning Machinery Market Segmentations
By Machine Type
- Ring Spinning Machine
- Rotor Spinning Machine (Open-End Spinning)
- Air-Jet Spinning Machine
- Friction Spinning Machine
- Others (e.g., Vortex, Electrostatic)
By Operation Type
- Automatic
- Semi-Automatic
- Manual
By Material Type
- Natural Fibers (Cotton, Wool, etc.)
- Synthetic Fibers (Polyester, Nylon, etc.)
- Blended Fibers
By End-Use Industry
- Apparel and Fashion
- Home Textiles
- Industrial Textiles
- Medical Textiles
- Automotive Textiles
- Others
By Spinning Process
- Short Staple Spinning
- Long Staple Spinning
By Sales Channel
- Direct Sales
- Distributors and Dealers
- Online Channels
United States Spinning Machinery Market Outlook
The supplied dataset does not allocate the USD 1,664.31 million 2026 total across U.S. regions, states or counties; therefore, regional percentage shares are not fabricated. Nationally, ring spinning contributes approximately 35.46%, air-jet 27.00%, rotor 20.11%, friction 12.43% and other machines 5.01%. These technology shares provide the consistent basis for evaluating equipment requirements across U.S. textile-producing clusters.
Regional investment is expected to concentrate around established textile and technical-fabric manufacturing corridors where automation economics are strongest. National operation-type figures show automatic machinery at approximately 46.06%, semi-automatic at 32.29% and manual equipment at 21.66% in 2026. USMCA sourcing also remains relevant to regional yarn capacity: 93% of qualifying apparel imports from member countries claimed duty-free treatment in the first five months of 2026, while approximately 92% complied with yarn-forward rules.
Top players in United States spinning machinery market
- Rieter
- Saurer
- Trützschler Group
- Murata Machinery
- Toyota Industries Corporation
- Lakshmi Machine Works
- Savio Macchine Tessili
- Marzoli Machines Textile
- Jingwei Textile Machinery
- TMT Machinery
- A.T.E. Enterprises
- Itema Group
Top Companies
-
Rieter
A company-specific U.S. percentage share is not disclosed in the supplied dataset and is therefore not estimated. Rieter is strongly positioned in ring, compact and automated spinning systems, with solutions capable of automating up to 85% of manual work. Its Vision 2027 architecture targets 3 skilled operators per 10,000 spindles per shift and approximately 1.9 tons of yarn output, while newer preparation systems offer 800 kg/hour throughput, 33% higher productivity, 30% lower energy consumption and 63% lower compressed-air consumption.
Recent Developments in United States Spinning Machinery Market
- 2026: Rieter highlighted compact-spinning upgrades capable of delivering a documented 7% productivity increase alongside improved yarn quality.
- 2025: Rieter presented its fully automated spinning-mill pathway, including automated bale transport, can transport, packaging, palletizing and labeling.
- 2025: Murata Machinery continued international promotion of VORTEX technology, reinforcing commercial focus on air-based spinning systems and shortened yarn-production processes.
Research Methodology
The analysis uses 2025 as the base year, 2026 as the current year and 2026–2034 as the forecast period, with 2022–2024 treated as historical years. Mandatory supplied numerical tables are the primary source for market valuation, segment contribution and CAGR calculations. The 2026 machine-type total of USD 1,664.31 million and 2034 forecast of USD 2,498.60 million underpin the forecast framework, while operation-type data provides an independent segmentation view ranging from USD 1,665.04 million in 2026 to USD 2,509.18 million in 2034. Percentage contributions were calculated directly from supplied values; no unavailable regional, material, end-use, process, channel or company-share figures were fabricated. Technology and industry context was cross-checked against manufacturer and current industry sources.
Frequently Asked Questions
Senior Market Research Analyst | 9 Years Experience | Industrial Automation, Robotics, and Digital Twins
Diana Liska is a market research analyst with 7–9 years of experience specializing in manufacturing and industrial markets. Contributed to 70+ research reports for global clients. Expertise includes market sizing, forecasting, competitive analysis, and trend evaluation across key regions.