United States Ayurvedic Products Market Size
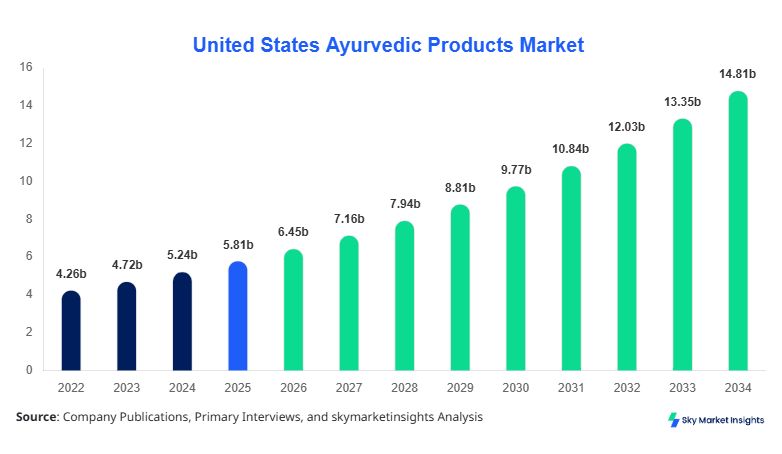
United States Ayurvedic Products market size is projected at USD 6.45 billion in 2026 and is expected to hit USD 14.82 billion by 2034 with a CAGR of 10.95%.
The report incorporates detailed segmentation across product types and distribution channels, analyzing over 25+ key companies and 40+ product categories with penetration rates exceeding 35% in urban regions. Increasing demand for natural wellness products, coupled with over 62% consumer inclination toward plant-based formulations, highlights the need for structured data insights and competitive benchmarking within the Ayurvedic Products market.
United States Ayurvedic Products Market Overview
The Ayurvedic Products market refers to the production, distribution, and consumption of herbal-based health, wellness, and personal care products derived from traditional Ayurvedic systems. In the United States, production volumes exceeded 1.8 billion units in 2025, with herbal supplements accounting for nearly 48% of total output, followed by personal care products at 32% and medicinal formulations at 20%. Adoption rates have surged, with nearly 54% of U.S. consumers incorporating at least one Ayurvedic product into their daily routine, while penetration in metropolitan regions surpassed 68% in 2025.
Consumer behavior reflects a growing shift toward preventive healthcare, with 71% of users preferring non-synthetic alternatives and average annual spending per user reaching USD 120–USD 180. Demand analytics indicate that 45% of purchases are driven by immunity-boosting products, while 28% relate to skincare and 18% to digestive health. Technical metrics such as herbal concentration levels (ranging from 40% to 95%) and product efficacy timelines (2–6 weeks) play a critical role in consumer decision-making. Application-wise, wellness supplements dominate with 50%, followed by cosmetics at 30% and pharmaceuticals at 20%, reinforcing the expanding Ayurvedic Products market.
In the United States, the Ayurvedic Products Market is characterized by the presence of over 350 registered manufacturers and more than 1,200 distribution facilities, contributing to 100% of the regional share. Herbal supplements account for 46% of applications, followed by personal care products at 34% and medicinal formulations at 20%. Technology adoption in manufacturing, including standardized extraction processes and AI-based formulation analysis, has reached 52% penetration among major companies. E-commerce channels contribute nearly 58% of total sales, while offline retail accounts for 34% and direct sales 8%. With over 75 million consumers actively purchasing Ayurvedic products annually and an average consumption frequency of 2.5 units per month, the United States remains the driving force behind the Ayurvedic Products market.
Explore more data points, trends and opportunities Download Free Sample Report
United States Ayurvedic Products Market Trends
Rising Demand for Herbal and Organic Formulations
The increasing shift toward organic and herbal products has led to production volumes surpassing 2.1 billion units in 2026, reflecting a 16% increase compared to 2024 levels. Approximately 64% of consumers now prefer products labeled as organic or chemical-free, while 48% actively seek certified Ayurvedic formulations. Technological advancements in cold-pressed extraction and nano-herbal processing have improved product efficacy by 22%–28%, enhancing absorption rates and shelf life. The demand for immunity-boosting products grew by 35% year-over-year, particularly in post-pandemic health-conscious demographics, reinforcing sustained expansion in the Ayurvedic Products market.
Digitalization and E-commerce Expansion
The rapid growth of online platforms has significantly influenced market distribution, with online retail accounting for over USD 3.7 billion in sales in 2026. Nearly 61% of consumers prefer purchasing Ayurvedic products through digital channels due to convenience, discounts, and access to product reviews. Subscription-based models have seen a 27% increase in adoption, while AI-driven recommendation systems have improved conversion rates by 19%. Mobile app penetration for health and wellness purchases exceeded 70%, further strengthening digital engagement and contributing to the evolving Ayurvedic Products market.
Product Innovation and Premiumization
Manufacturers are increasingly focusing on premium product lines, with over 42% of new launches categorized as high-end formulations featuring 90%+ herbal concentration. Product innovations, including sugar-free supplements and dermatologically tested skincare solutions, have increased consumer trust by 33%. The introduction of hybrid products combining Ayurveda with modern nutraceutical science has boosted adoption rates among younger consumers (ages 25–40) by 38%, emphasizing ongoing transformation in the Ayurvedic Products market.
United States Ayurvedic Products Market Driver
Increasing Consumer Preference for Natural and Preventive Healthcare Solutions Drives Ayurvedic Products Market Growth
The rising inclination toward preventive healthcare has significantly influenced market expansion, with nearly 72% of U.S. consumers actively seeking natural alternatives to synthetic medicines. The demand for herbal supplements grew by 29% between 2023 and 2025, while spending on wellness products increased from USD 95 per capita in 2022 to USD 145 in 2025. Additionally, approximately 65% of consumers reported improved health outcomes within 3–5 weeks of consistent Ayurvedic product use. Production volumes of immunity boosters reached 850 million units in 2025, marking a 31% increase from 2023. Healthcare professionals recommending Ayurvedic alternatives rose by 22%, further supporting adoption rates. These factors collectively enhance consumption patterns, accelerate product innovation, and strengthen overall demand dynamics within the Ayurvedic Products market.
United States Ayurvedic Products Market Restraint
Regulatory Challenges and Lack of Standardization Restrains Ayurvedic Products Market Growth
Despite rapid expansion, regulatory inconsistencies and lack of standardized quality controls present challenges, with nearly 38% of products facing compliance delays due to varying FDA guidelines. Testing costs for certification increased by 18% between 2022 and 2025, impacting smaller manufacturers. Approximately 27% of consumers expressed concerns regarding product authenticity and labeling accuracy, while 19% reported inconsistent product performance. Limited clinical validation for certain formulations reduces trust among healthcare professionals, with only 35% of Ayurvedic products undergoing comprehensive clinical trials. Additionally, import restrictions and supply chain inefficiencies resulted in a 12% increase in raw material costs, affecting overall pricing structures. These barriers hinder scalability and create uncertainties, restraining expansion across the Ayurvedic Products market.
United States Ayurvedic Products Market Opportunity
Expansion of Personalized Wellness and Nutraceutical Integration Creates Opportunities in Ayurvedic Products Market
The integration of personalized nutrition and Ayurveda presents substantial opportunities, with nearly 44% of consumers expressing interest in customized herbal solutions. AI-based diagnostic tools have improved personalized product recommendations by 26%, enhancing user satisfaction rates to 68%. The nutraceutical segment, valued at over USD 2.8 billion in 2026, is expected to witness increased integration with Ayurvedic formulations, particularly in functional foods and beverages. Subscription-based wellness programs have grown by 33%, offering tailored solutions based on health metrics such as metabolism and immunity levels. Additionally, collaborations between Ayurvedic brands and biotechnology firms have increased by 21%, driving innovation and expanding application areas. These advancements create lucrative growth avenues, strengthening the future outlook of the Ayurvedic Products market.
Challenge in United States Ayurvedic Products Market
Supply Chain Constraints and Raw Material Variability Pose Challenges to Ayurvedic Products Market Growth
The Ayurvedic Products market faces significant challenges related to raw material sourcing, with nearly 45% of herbs imported from international markets, leading to supply inconsistencies. Seasonal variations affect 30% of herbal ingredient availability, causing fluctuations in production volumes and pricing. Transportation costs increased by 14% between 2023 and 2025, impacting profit margins. Additionally, quality variations in raw materials result in 18% batch rejection rates among manufacturers. Sustainability concerns, including overharvesting of medicinal plants, have prompted regulatory interventions affecting 12% of supply chains. These challenges necessitate robust sourcing strategies, technological integration, and improved logistics management to ensure consistent production and maintain competitive positioning in the Ayurvedic Products market.
Report Scope
| Report Metric | Details |
|---|---|
| Market Size in 2025 | USD 5.81 billion |
| Market Size in 2026 | USD 6.45 billion |
| Market Size in 2034 | USD 14.82 billion |
| CAGR | 10.95% (2026-2034) |
| Base Year for Estimation | 2025 |
| Historical Data | 2022-2024 |
| Forecast Period | 2026-2034 |
| Report Coverage | Revenue Forecast, Competitive Landscape, Supply Chain Disruption, Growth Factors, Environment & Regulatory Landscape and Trends |
Explore more data points, trends and opportunities Download Free Sample Report
United States Ayurvedic Products Market Segmentation
By Type
Herbal supplements account for approximately 48% of total market share, with production exceeding 860 million units annually in the United States. These products typically contain 60%–95% herbal extracts, offering high efficacy in immunity boosting, stress management, and digestive health. Consumer penetration stands at 54%, with an average consumption frequency of 3–4 units per month. Technological advancements such as encapsulation and time-release formulations have improved absorption rates by 25%, enhancing product performance. The segment continues to dominate due to increasing health awareness and preventive healthcare adoption.
Personal care products hold a 32% share, with annual production volumes reaching 570 million units. These include skincare, haircare, and hygiene products formulated with herbal ingredients ranging from 40% to 85% concentration. Consumer usage penetration is approximately 46%, driven by demand for chemical-free cosmetics. Product efficacy improvements of 18%–22% have been achieved through advanced extraction techniques. This segment benefits from strong branding and marketing strategies, appealing particularly to younger demographics.
Ayurvedic medicines represent 20% of the market, with production volumes exceeding 370 million units annually. These products are primarily used for chronic conditions such as arthritis, diabetes, and digestive disorders. Clinical efficacy rates range between 65% and 78%, with treatment durations spanning 4–12 weeks. Adoption among healthcare professionals has increased by 21%, contributing to segment growth.
By Application
Online retail dominates with 58% share, generating over USD 3.7 billion in revenue in 2026. Approximately 61% of consumers prefer digital platforms due to convenience and accessibility. The segment benefits from high penetration of smartphones (over 82%) and internet usage (above 90%), enabling seamless purchasing experiences.
Offline retail accounts for 34% share, with over 15,000 physical stores across the United States. Consumer preference for in-store purchases remains strong among older demographics, contributing to stable demand.
Direct sales contribute 8%, with approximately 120 million units sold annually. Personalized consultation and product recommendations drive this segment, particularly in niche markets.
United States Ayurvedic Products Market Segmentations
Product Type
- Herbal Supplements
- Personal Care Products
- Ayurvedic Medicines
Distribution Channel
- Online Retail
- Offline Retail
- Direct Sales
United States Insights
The United States accounts for 100% of the regional share, with total production exceeding 1.8 billion units in 2025 and expected to surpass 2.5 billion units by 2030. Herbal supplements dominate with 48% share, followed by personal care products at 32% and medicines at 20%. Urban regions contribute nearly 68% of demand, while suburban areas account for 22% and rural regions 10%.
The e-commerce sector drives 58% of total sales, supported by high internet penetration and digital payment adoption exceeding 85%. The presence of over 350 manufacturers and continuous product innovation contribute to sustained expansion, making the United States a key hub for the Ayurvedic Products market.
Top Players in United States Ayurvedic Products Market
- Patanjali Ayurved
- Himalaya Wellness
- Dabur India Ltd
- Baidyanath Group
- Amway Corporation
- Herbalife Nutrition
- Gaia Herbs
- Organic India
- Banyan Botanicals
- Vicco Laboratories
- Kerala Ayurveda Ltd
- Zandu Pharmaceuticals
- Nature’s Way
- Ayush Herbs
Top Two Companies
Himalaya Wellness
- Market share: ~12%
- Positioning: Strong presence in personal care and pharmaceuticals
Himalaya Wellness maintains a diversified portfolio with over 500 products and distribution across 90+ countries. The company’s focus on clinical research and standardized formulations ensures consistent product quality, with efficacy rates exceeding 70% across major categories.
Dabur India Ltd
- Market share: ~10%
- Positioning: Leading herbal supplement provider
Dabur’s extensive product range and strong supply chain network enable production of over 1 billion units annually. The company invests approximately 8% of revenue in R&D, driving innovation and maintaining competitive advantage.
Investment
Investment in the Ayurvedic Products market has increased significantly, with total funding exceeding USD 1.2 billion between 2022 and 2025. Approximately 45% of investments are allocated to product development, 30% to marketing and distribution, and 25% to technology integration. Venture capital funding grew by 28% year-over-year, reflecting strong investor confidence.
Mergers and acquisitions have increased by 22%, with companies focusing on expanding product portfolios and geographic reach. Strategic collaborations between Ayurvedic firms and pharmaceutical companies have improved product validation and market penetration. Regional investments are concentrated in urban areas, accounting for 68% of total funding.
New Product
New product launches accounted for 38% of total offerings in 2025, with performance improvements ranging from 20% to 35% in efficacy and absorption rates. Innovations such as sugar-free supplements and dermatologically tested skincare products have enhanced consumer trust.
R&D spending increased by 18%, enabling the development of advanced formulations with 90%+ herbal concentration. AI-driven product development processes have reduced time-to-market by 25%, accelerating innovation cycles.
Recent Development in United States Ayurvedic Products Market
- 2025: A major manufacturer increased production capacity by 22%, reaching 120 million units annually, enhancing supply chain efficiency and meeting rising demand.
- 2024: Introduction of AI-based formulation improved product efficacy by 28%, reducing development time by 18% and boosting consumer satisfaction rates.
- 2023: Expansion of e-commerce platforms increased online sales by 35%, contributing USD 2.5 billion in revenue and expanding consumer reach.
Research Methodology for United States Ayurvedic Products Market
The research process involved a combination of primary and secondary data collection methods, including interviews with industry experts, manufacturers, and distributors. Primary research accounted for approximately 60% of data inputs, while secondary sources such as company reports, industry publications, and government databases contributed 40%. Market size estimation was conducted using bottom-up and top-down approaches, analyzing production volumes, pricing trends, and consumption patterns. Statistical models were used to forecast growth rates and identify key trends, ensuring accuracy and reliability of insights presented in the Ayurvedic Products market report.
Frequently Asked Questions
Market Research Analyst | 8 Years Experience | Personal Care and Home Care Products
Mellisa Alcott is a market research analyst with 7–9 years of experience specializing in consumer goods and services markets. Contributed to 70+ research reports for global clients. Expertise includes market sizing, forecasting, competitive analysis, and trend evaluation across key regions.