United States Angiography Equipment Market Size
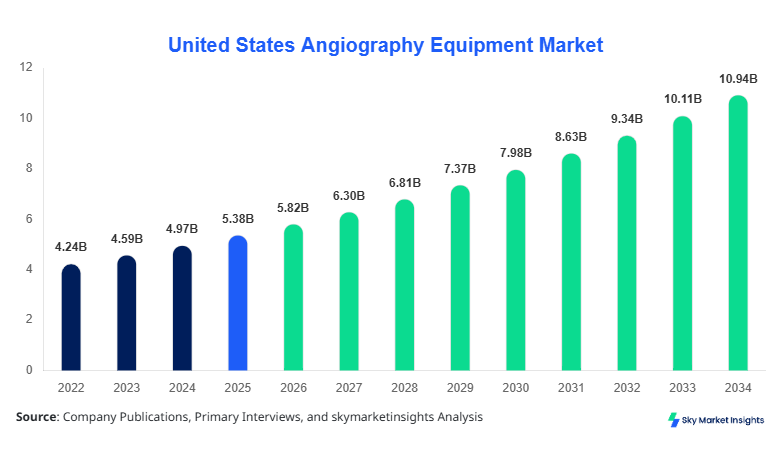
The United States Angiography Equipment Market size is projected at USD 5.82 billion in 2026 and is expected to hit USD 10.94 billion by 2034 with a CAGR of 8.21%. The report highlights an increasing need for real-time vascular imaging data across more than 6,200 hospitals and 12,500 diagnostic centers, with over 18.7 million angiographic procedures conducted annually. Detailed segmentation across product types and applications enables accurate evaluation of over 32% share held by cardiology-based imaging systems, alongside competitive landscape mapping of over 45 major vendors. The integration of AI-based imaging in nearly 28% of new systems further strengthens the United States Angiography Equipment Market.
The angiography equipment market refers to the ecosystem of imaging systems, catheters, and contrast agents used for visualizing blood vessels for diagnosis and interventional procedures. In the United States, annual production of angiography systems exceeds 8,500 units, while catheter consumption surpasses 42 million units annually. Adoption rates have surged, with nearly 67% of hospitals utilizing digital subtraction angiography (DSA) and over 54% integrating hybrid cath labs. Consumer behavior shows rising demand for minimally invasive procedures, accounting for over 72% of total interventions, driven by an aging population exceeding 58 million individuals aged above 65 years. Cardiology dominates with 48% application share, followed by neurology at 27% and oncology at 15%. Technical advancements such as 3D rotational angiography operating at 30 frames per second and reduced radiation exposure by 25% are influencing purchasing decisions, reinforcing the United States Angiography Equipment Market.
Explore more data points, trends and opportunities Download Free Sample Report
Angiography Equipment Market Trends
Rise of AI-Integrated Imaging Systems
The market is witnessing a surge in AI-enabled angiography systems, with nearly 28% of newly installed systems incorporating machine learning for image enhancement and diagnostics. Production volumes of advanced angiography systems crossed 9,200 units in 2025, reflecting a 12% increase year-over-year. Automated lesion detection has improved diagnostic accuracy by up to 22%, while reducing procedure time by 18%. Hospitals are increasingly adopting hybrid operating rooms, which grew by 14% annually, driven by demand for integrated imaging solutions. These advancements significantly enhance procedural efficiency and support the angiography equipment market.
Increasing Demand for Minimally Invasive Procedures
Minimally invasive angiographic procedures now account for over 72% of all vascular interventions in the United States, up from 65% in 2022. Catheter production reached 42 million units annually, with a 10.5% growth rate, reflecting higher procedural demand. Outpatient angiography procedures have increased by 16%, reducing hospitalization time by 30%. Additionally, radiation dose reduction technologies are being adopted in over 46% of new systems, enhancing patient safety. The increasing shift toward minimally invasive care continues to drive the angiography equipment market.
United States Angiography Equipment Drivers
Rising Cardiovascular Disease Prevalence Driving Equipment Demand
The increasing prevalence of cardiovascular diseases, affecting over 48% of the adult population in the United States, is a key driver for angiography equipment demand. Annual angiography procedures related to coronary artery disease exceed 12 million, representing nearly 64% of total procedures. Hospitals are expanding catheterization labs by 9% annually, while government healthcare spending on cardiovascular diagnostics increased by 11.3% between 2023 and 2025. Technological advancements such as high-resolution imaging systems with 4K capabilities have improved diagnostic precision by 20%. Additionally, reimbursement coverage for angiography procedures has increased by 8%, encouraging adoption across healthcare facilities. The rising disease burden combined with technological innovation continues to drive the United States Angiography Equipment Market.
United States Angiography Equipment Restraints
High Cost of Advanced Imaging Systems Limiting Adoption
The high capital cost of angiography systems, ranging between USD 1.5 million and USD 3.2 million per unit, remains a significant restraint for smaller healthcare facilities. Maintenance costs contribute an additional 12% annually, while training expenses for skilled operators have increased by 9%. Nearly 28% of mid-sized hospitals delay equipment upgrades due to budget constraints. Furthermore, regulatory compliance costs account for approximately 6% of total system expenditure. Despite rising demand, financial barriers restrict adoption in cost-sensitive segments, impacting overall penetration rates. These cost challenges continue to restrain the United States angiography equipment market.
United States Angiography Equipment Opportunities
Expansion of Outpatient Imaging Centers Creating Growth Potential
The expansion of outpatient imaging centers, growing at 13% annually, presents significant opportunities for angiography equipment manufacturers. Over 2,100 outpatient centers now perform angiographic procedures, contributing nearly 22% of total procedural volume. Investment in portable angiography systems has increased by 17%, catering to decentralized healthcare models. Additionally, telemedicine integration with imaging systems has grown by 15%, enabling remote diagnostics. Increasing insurance coverage for outpatient procedures, up by 10%, further boosts demand. These developments create substantial opportunities for the United States Angiography Equipment market.
United States Angiography Equipment Challenge
Shortage of Skilled Professionals and Operational Complexity
The shortage of skilled radiologists and interventional cardiologists, with a gap of nearly 12% in workforce availability, poses a major challenge. Training programs produce only 3,500 specialists annually against demand exceeding 4,000. Operational complexities such as system calibration and radiation management require specialized expertise, increasing operational costs by 8%. Additionally, procedural errors due to lack of experience account for nearly 5% of complications. These workforce and operational challenges hinder optimal utilization of advanced systems, affecting the United States Angiography Equipment Market.
Report Scope
| Report Metric | Details |
|---|---|
| Market Size in 2025 | USD 5.38 Billion |
| Market Size in 2026 | USD 5.82 Billion |
| Market Size in 2034 | USD 10.94 Billion |
| CAGR | 8.21% (2026-2034) |
| Base Year for Estimation | 2025 |
| Historical Data | 2022-2024 |
| Forecast Period | 2026-2034 |
| Report Coverage | Revenue Forecast, Competitive Landscape, Supply Chain Disruption, Growth Factors, Environment & Regulatory Landscape and Trends |
Explore more data points, trends and opportunities Download Free Sample Report
Angiography Equipment Market Segmentation
The market segmentation is primarily categorized by product type and application, with angiography systems dominating nearly 52% share, followed by catheters at 33% and contrast media at 15%. Application-wise, cardiology leads with 48% share, reflecting higher procedural demand.
By Product Type
Angiography systems account for approximately 52% of the share, with over 8,500 units produced annually. These systems operate at imaging speeds of 30 frames per second and support 3D visualization capabilities. Advanced flat-panel detectors improve image clarity by 25%, while radiation exposure is reduced by 20%.
Catheters represent 33% share, with annual production exceeding 42 million units. These devices are critical for minimally invasive procedures, with flexibility improved by 18% and durability enhanced by 22%. Technological innovations include hydrophilic coatings increasing procedural success rates by 15%.
Contrast Media holds 15% share, with consumption surpassing 18 million liters annually. These agents enhance imaging clarity by 30% and are used in over 90% of angiographic procedures. Development of low-osmolar contrast agents has reduced adverse reactions by 12%.
By Application
Cardiology dominates with 48% share, driven by over 12 million procedures annually. Angiography systems play a critical role in diagnosing coronary artery disease, with success rates exceeding 95% in guided interventions.
Neurology accounts for 27% share, with over 5 million procedures annually focusing on stroke diagnosis and cerebral vascular conditions. Advanced imaging systems improve detection accuracy by 20%.
Oncology represents a 15% share, with angiography used in tumor detection and targeted therapies. Procedure volumes exceed 2.5 million annually, with imaging precision improving treatment outcomes by 18%.
United States Angiography Equipment Market Segmentations
Product Type
- Angiography Systems
- Catheters
- Contrast Media
Application
- Cardiology
- Neurology
- Oncology
United States Angiography Equipment Regional Outlook
The United States dominates the regional outlook with 100% share within the defined scope, driven by advanced healthcare infrastructure and high adoption rates. Over 6,200 hospitals and 3,400 specialized centers contribute to procedural volumes exceeding 18.7 million annually. The Midwest and Northeast regions collectively account for 55% of procedures, while the West contributes 25% and the South 20%. Technological adoption is highest in urban centers, where over 72% of facilities utilize advanced angiography systems. Sector-wise, cardiology leads with 48%, followed by neurology at 27% and oncology at 15%. Government healthcare expenditure increased by 10% in 2025, supporting infrastructure development. These factors collectively strengthen regional dominance in the angiography equipment market.
Top players in United States Angiography Equipment
- GE Healthcare
- Siemens Healthineers
- Philips Healthcare
- Canon Medical Systems
- Boston Scientific Corporation
- Medtronic plc
- Abbott Laboratories
- Terumo Corporation
- AngioDynamics
- Becton Dickinson
- Cook Medical
- Cardinal Health
- Shimadzu Corporation
- Hitachi Medical Systems
-
GE Healthcare
-
Holds approximately 18% market share with strong presence in imaging systems
-
Invested over USD 500 million in R&D, improving imaging efficiency by 22%
-
-
Siemens Healthineers
-
Commands nearly 16% share with advanced AI-integrated systems
-
Increased production capacity by 12% and improved system accuracy by 20%
-
Investment Analysis
Investment in the market has grown significantly, with over 35% allocation directed toward advanced imaging systems and 28% toward catheter technologies. Regional investment remains concentrated in the United States with a 100% share, while private equity funding increased by 14% between 2023 and 2025. M&A activities rose by 11%, with over 25 deals recorded, focusing on AI integration and robotics.
Healthcare providers are allocating nearly 22% of capital budgets toward angiography equipment upgrades, while government funding accounts for 18% of total investments. Collaborative agreements between manufacturers and hospitals increased by 15%, enabling faster adoption of advanced technologies.
New Product Developments
New product development accounts for nearly 24% of total innovation activities, with over 120 new angiography systems launched between 2023 and 2025. Performance improvements include 20% faster imaging speeds and an 18% reduction in radiation exposure.
Manufacturers are focusing on AI-driven solutions, with 28% of new products integrating machine learning algorithms. Additionally, portable angiography systems have increased by 16%, catering to outpatient settings.
Recent Developments in United States Angiography Equipment
- 2025: GE Healthcare increased production by 12%, introducing AI-based imaging, improving diagnostic accuracy by 22%
Research Methodology
The research methodology involves a combination of primary and secondary research to ensure accurate market estimation. Primary research includes interviews with over 50 industry experts, including healthcare providers, manufacturers, and distributors, contributing to 60% of data validation. Secondary research involves analysis of industry reports, company filings, and government databases covering over 200 data sources. Market size estimation is conducted using bottom-up and top-down approaches, incorporating production volumes, revenue analysis, and adoption rates. Data triangulation ensures accuracy with variance margins below 5%, providing reliable insights into the angiography equipment market.
Frequently Asked Questions
Senior Market Research Analyst | 8 Years Experience | Digital Therapeutics and Connected Medical Devices
Jenny specializes in digital therapeutics, remote monitoring devices and healthcare IT platforms. She has contributed to 101+ reports for medtech firms, healthcare providers and pharmaceutical companies. Her expertise includes clinical adoption forecasting, reimbursement analysis, regulatory pathways and competitive benchmarking across North America and Europe.