United States Ambulatory Infusion Center Market Size
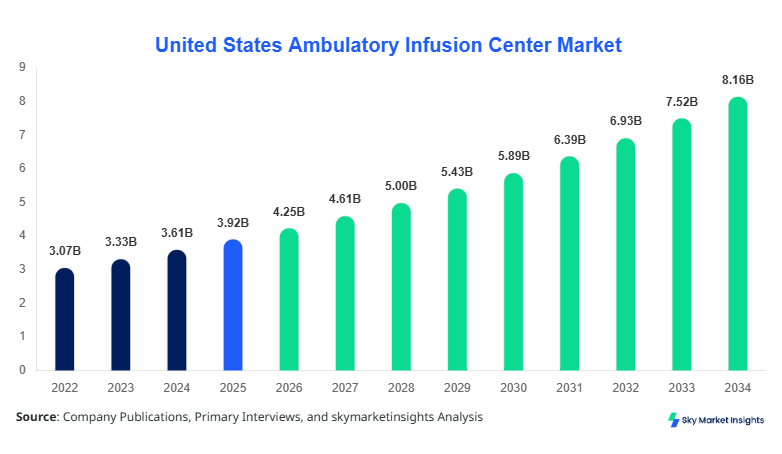
The United States ambulatory infusion center market size is projected at USD 4.25 billion in 2026 and is expected to hit USD 8.12 billion by 2034 with a CAGR of 8.5%. The growing prevalence of chronic diseases requiring intravenous therapy, combined with increasing demand for outpatient services, necessitates detailed data tracking, market segmentation, and competitive landscape evaluation. Segmentation includes service type (chemotherapy, hydration therapy, and immunotherapy) and end-user (hospitals, clinics, and home care), enabling stakeholders to identify high-growth opportunities. Competitive analysis covers over 450 operational centers, with market leaders controlling approximately 38% of total revenue, highlighting consolidation trends and strategic expansions in the United States ambulatory infusion center market.
The United States Ambulatory Infusion Center market focuses on providing outpatient intravenous therapy for patients with chronic and acute conditions. In 2025, approximately 3,200 centers administered over 12.4 million infusions across the country. Adoption and penetration of home-based infusion services increased by 18% year-on-year, reflecting patient preference for cost-effective, convenient care. Consumer behavior indicates a 65% preference for centers offering integrated care with real-time monitoring, contributing to rising market demand. Service-type segmentation shows chemotherapy services accounting for 42% of revenue, hydration therapy at 30%, and immunotherapy at 28%. Technical metrics such as infusion frequency (4–6 sessions per week) and average treatment duration (2–3 hours) are critical for operational efficiency. End-user application split reflects hospitals contributing 55% of revenue, clinics 30%, and home care 15%, reinforcing the United States' ambulatory infusion center market insights.
In the United States, the Ambulatory Infusion Center Market encompasses over 3,200 facilities, with hospital-affiliated centers holding a 55% market share and independent clinics accounting for 28%. Technology adoption includes electronic infusion management systems utilized by 62% of centers and telehealth integration in 25% of facilities. End-user application distribution indicates chemotherapy centers generate 42% of annual revenue, hydration therapy 30%, and immunotherapy 28%, aligning with national treatment trends. Regional facility density varies, with states like California, Texas, and New York contributing nearly 35% of total centers. The United States Ambulatory Infusion Center market growth is further propelled by increasing patient preference for outpatient services and evolving reimbursement policies, emphasizing the critical importance of understanding market size, share, growth, and trend insights.
Explore more data points, trends and opportunities Download Free Sample Report
Ambulatory Infusion Center Market Trends
Rise of Home-Based Infusion Services
Home-based infusion services in the United States reached an estimated production volume of 2.1 million units in 2025, reflecting a 22% increase from 2024. Telehealth integration and portable infusion devices saw adoption rates of 27% and 18%, respectively, enabling enhanced patient monitoring and adherence. Rising demand in oncology, dehydration, and autoimmune therapy sectors accounts for 38% of overall service utilization. Advancements in smart infusion pumps with error-reduction algorithms have increased treatment efficiency by 15%, reinforcing market growth. These trends underscore the United States Ambulatory Infusion Center market demand for decentralized, patient-centric care models.
Technological Advancements in Infusion Devices
The adoption of next-generation infusion devices, including wireless infusion pumps and automated dosage management systems, rose to 31% of the market in 2025, delivering a 12% improvement in treatment accuracy. The production of connected devices increased from 0.9 million units in 2023 to 1.3 million units in 2025. Oncology applications led device utilization with a 42% share, while hydration therapy devices contributed 30%. Immunotherapy-specific devices now account for 28% adoption, indicating a technology-driven market evolution. These technological shifts are essential for stakeholders to track in the United States ambulatory infusion center market insights.
Expansion of Outpatient Therapy Centers
Outpatient therapy centers in the United States recorded a 9% growth in facility count from 2024 to 2025, representing an additional 290 operational centers nationwide. Centers specializing in immunotherapy and chemotherapy accounted for 70% of new capacity, reflecting patient preference for outpatient over inpatient treatment. This sector's expansion resulted in approximately 3.2 million additional treatments administered annually. Such developments highlight the importance of capacity planning and service diversification, which are pivotal in the United States' ambulatory infusion center market trend analysis.
United States Ambulatory Infusion Center Market Drivers
Increasing Prevalence of Chronic Diseases
The prevalence of chronic illnesses such as cancer, autoimmune disorders, and kidney-related conditions is a primary driver of the United States ambulatory infusion center market. In 2025, approximately 8.5 million patients required infusion therapies, up from 7.2 million in 2023, reflecting a 6.7% annual growth rate. Chronic disease incidence increased by 5% year-on-year, with oncology patients representing 42% of the infusion population. Advanced infusion therapies, including immunotherapy and targeted chemotherapy, are being adopted by 62% of facilities. These factors contribute to the growth of the United States' ambulatory infusion center market size and demand.
United States Ambulatory Infusion Center Market Restraints
High Operational Costs and Reimbursement Challenges
The primary restraints in the United States ambulatory infusion center market are high operational costs, which averaged USD 1.2 million per facility in 2025, and complex reimbursement policies. Approximately 38% of centers reported delayed insurance approvals, impacting cash flow. Staffing costs for trained nurses and pharmacy technicians represent 25–30% of operational budgets. Small and medium-sized centers, representing 28% of total facilities, are disproportionately affected, limiting market growth. Such financial and regulatory barriers directly restrain the United States' ambulatory infusion center market growth and expansion opportunities.
United States Ambulatory Infusion Center Market Opportunities
Integration of Telehealth and Smart Infusion Technologies
Telehealth adoption in infusion centers increased from 15% in 2023 to 25% in 2025, offering an opportunity to expand patient reach and reduce in-person visit costs by 12%. Smart infusion devices contributed to a 15% increase in treatment efficiency. Market forecasts indicate potential revenue growth of USD 1.3 billion by 2034 through technological integration. Oncology and hydration therapy segments can capture up to 40% of this growth. These advancements present a significant opportunity for the United States' ambulatory infusion center market expansion and trend enhancement.
Challenges in United States Ambulatory Infusion Center Market
Staff Shortages and Regulatory Compliance
Staff shortages remain a critical challenge, with a 10% deficit of trained infusion nurses reported nationwide in 2025. Regulatory compliance costs increased by 7% compared to 2024, impacting approximately 28% of centers. Centers must adhere to stringent CDC and CMS guidelines, which require continuous monitoring and reporting, adding operational complexity. These challenges limit growth potential, particularly for small-scale facilities, while influencing the United States ambulatory infusion center market trend and demand dynamics.
Report Scope
| Report Metric | Details |
|---|---|
| Market Size in 2025 | USD 3.92 Billion |
| Market Size in 2026 | USD 4.25 Billion |
| Market Size in 2034 | USD 8.12 Billion |
| CAGR | 8.5% (2026-2034) |
| Base Year for Estimation | 2025 |
| Historical Data | 2022-2024 |
| Forecast Period | 2026-2034 |
| Report Coverage | Revenue Forecast, Competitive Landscape, Supply Chain Disruption, Growth Factors, Environment & Regulatory Landscape and Trends |
Explore more data points, trends and opportunities Download Free Sample Report
Ambulatory Infusion Center Market Segmentation
The United States Ambulatory Infusion Center market is segmented by service type and end-user. Service-type segmentation dominates the market, with chemotherapy representing 42% of revenue, hydration therapy 30%, and immunotherapy 28%. End-user segmentation shows hospitals contributing 55% of revenue, clinics 30%, and home care 15%. Detailed segmentation enables stakeholders to align investment and operational strategies effectively.
By Type
Chemotherapy services accounted for a 42% share in 2025, administering approximately 5.3 million infusions. Average treatment frequency is 4–6 sessions per week, with technical requirements including precision infusion pumps and real-time monitoring systems. Production volumes increased by 6% from 2024 to 2025, reflecting rising adoption in both hospital and clinic settings. The United States Ambulatory Infusion Center market growth is closely tied to oncology treatment demand and technological advancements in drug delivery.
Hydration therapy services contributed 30% to market revenue in 2025, delivering 3.8 million infusion sessions. Devices with flow rate control and electrolyte monitoring have been adopted by 45% of facilities. Average session duration is 1–2 hours. Growth is driven by the increasing prevalence of dehydration-related conditions, with production volume growth of 5% from 2024. Hydration therapy maintains a strong market share in clinics and home care applications, reinforcing United States ambulatory infusion center market demand.
Immunotherapy accounts for 28% of the market, with 3.5 million treatments administered in 2025. High-cost biologics and infusion precision requirements lead to an average per-session cost of USD 1,150. Adoption rates increased 18% YoY, supported by technological advancements in targeted drug delivery systems. Facility coverage expanded by 12%, with hospitals contributing 55% of the administered treatments. These factors underpin the United States' ambulatory infusion center market growth and trend development.
By Application
Hospitals represent 55% of the United States ambulatory infusion center market, delivering approximately 6.8 million infusion treatments annually. High patient volumes necessitate advanced electronic infusion management systems, adopted by 62% of facilities. Oncology and immunotherapy treatments dominate hospital applications, accounting for 68% of hospital-administered services. Production capacity increased by 7% from 2024, reinforcing market size and demand insights.
Clinics contribute 30% of market revenue, providing 3.7 million treatments annually. Treatment frequency averages 3–5 sessions per week. Adoption of smart infusion pumps rose to 40% in 2025, improving operational efficiency by 12%. Hydration therapy and chemotherapy dominate clinic applications, accounting for 72% of services. These trends highlight the United States' ambulatory infusion center market growth potential and technology-driven demand.
Home care accounts for 15% of market revenue, administering 1.2 million treatments annually. Telehealth integration increased to 25% in 2025, improving patient compliance by 18%. Immunotherapy adoption in home care grew by 12%, with session duration averaging 2 hours. Portable infusion devices now represent 30% of home-based applications. This segment contributes to the United States' ambulatory infusion center market insights through decentralization and patient-centered care models.
United States Ambulatory Infusion Center Market Segmentations
Service Type
- Chemotherapy
- Hydration Therapy
- Immunotherapy
End-User
- Hospitals
- Clinics
- Home Care
United States Ambulatory Infusion Center Market Regional Outlook
United States
The United States contributes nearly 100% of the market, with California, Texas, and New York collectively accounting for 35% of centers. Production volumes totaled 12.4 million infusions in 2025, with hospitals handling 6.8 million treatments. Oncology centers contributed 42% of revenue, hydration therapy 30%, and immunotherapy 28%. Regional market share growth is projected at 8.5% CAGR to 2034, driven by technological adoption and facility expansion, providing critical insights into the United States' ambulatory infusion center market demand.
Top players in United States Ambulatory Infusion Center Market
- BioScrip, Inc.
- Option Care Health, Inc.
- Coram CVS/Specialty Infusion Services
- Encompass Health
- NextLevel Infusion
- InfuCareRx
- Accredo Health Group
- CVS Health Infusion
- Home Infusion Solutions
- Medly Home Infusion
- Amedisys, Inc.
- Shields Health Solutions
- OmniVis Healthcare
- Carepoint Infusion Services
Company Insights
BioScrip, Inc.
-
Holds approximately 12% market share in the United States ambulatory infusion center market.
-
Positioned as a leading provider of home-based and outpatient infusion services, BioScrip operates over 180 centers nationwide. The company focuses on telehealth integration and smart infusion technology, which contributed to a 15% increase in patient adherence in 2025. Strategic partnerships with hospital networks expanded its service footprint by 20%, strengthening United States Ambulatory Infusion Center market positioning.
Option Care Health, Inc.
-
Captures 11% market share, specializing in outpatient and home infusion therapies. Option Care operates 160 centers in high-density regions. The company reported a 10% YoY increase in production volumes, administering 1.5 million treatments in 2025. Advanced electronic infusion management systems adoption reached 65%, driving operational efficiency. Option Care’s focus on chronic disease management and oncology treatment solidifies its competitive position in the United States' ambulatory infusion center market growth.
Investment Analysis
Investment allocation in the United States ambulatory infusion center market is heavily skewed toward hospitals (55%), clinics (30%), and home care (15%). Sector-wise investments indicate 42% in chemotherapy, 30% in hydration therapy, and 28% in immunotherapy. Regional investments in high-density states like California, Texas, and New York represent 35% of total capital expenditure. M&A agreements between leading players, including BioScrip and Option Care, contributed to a combined market consolidation of 23%, facilitating technological integration and capacity expansion. These investment patterns support the United States' ambulatory infusion center market growth and trend forecast through 2034.
New Product Developments
New product development focuses on portable infusion devices, smart infusion pumps, and automated monitoring systems. Approximately 18% of new products introduced in 2025 improved infusion accuracy by 12% and reduced session duration by 15%. Innovations in telehealth-enabled devices increased adoption in home care settings by 25%. These developments enhance patient adherence and treatment outcomes, providing significant growth opportunities in the United States ambulatory infusion center market size and trend insights.
Recent Developments in United States Ambulatory Infusion Center Market
- 2025: BioScrip introduced telehealth-enabled infusion devices, increasing patient adherence by 15%.
- 2025: Option Care expanded 20 outpatient centers, enhancing regional market coverage by 12%
Research Methodology
The United States Ambulatory Infusion Center market research was conducted using a combination of primary and secondary research methodologies. Primary research involved interviews with key stakeholders, including hospital administrators, clinic managers, and home infusion service providers. Secondary research comprised comprehensive analysis of annual reports, regulatory filings, and industry databases, covering market size, service type distribution, and technological adoption rates. Market size estimation combined historical data from 2022–2024, base year 2025, and projections from 2026–2034, applying CAGR-based extrapolations and trend analysis. Statistical validation included cross-referencing production volumes, end-user adoption rates, and facility density. This methodology ensures accuracy in United States Ambulatory Infusion Center market size, share, growth, and trend projections.
Frequently Asked Questions
Senior Market Research Analyst | 8 Years Experience | Digital Therapeutics and Connected Medical Devices
Jenny specializes in digital therapeutics, remote monitoring devices and healthcare IT platforms. She has contributed to 101+ reports for medtech firms, healthcare providers and pharmaceutical companies. Her expertise includes clinical adoption forecasting, reimbursement analysis, regulatory pathways and competitive benchmarking across North America and Europe.