United States Allografts Market Size
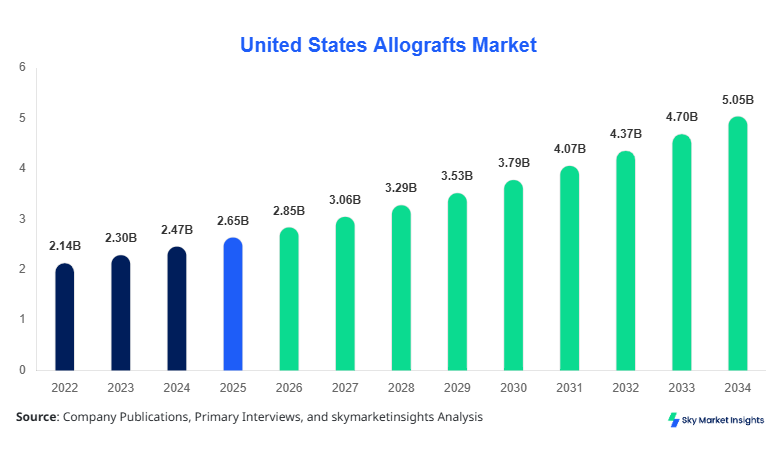
United States Allografts market size is projected at USD 2.85 billion in 2026 and is expected to hit USD 5.12 billion by 2034 with a CAGR of 7.4%. The rising demand for bone grafting procedures, increasing orthopedic surgeries, and the growth of regenerative medicine are driving factors behind this expansion. Detailed data collection on market trends, segmentation analysis, and competitive landscape evaluation are critical for understanding market dynamics. This report presents a comprehensive analysis of production, consumption, pricing trends, and technological adoption to assist stakeholders in decision-making. Additionally, competitive intelligence highlights strategies adopted by major players, product launches, and partnership agreements to maintain and increase market share.
The report provides insights into market size, share, growth, and trends, enabling investors and industry participants to forecast market potential accurately and identify strategic opportunities for expansion in the United States Allografts market.
The United States Allografts market size and trends provide actionable intelligence regarding segment dominance, regional demand, and technological adoption for stakeholders, ensuring informed investment and operational strategies.
The market analysis covers historical data from 2022 to 2024, offering valuable insight into production, demand, and pricing trends, which help validate forecasts from 2026–2034.
United States Allografts market size and share estimates are derived using both top-down and bottom-up approaches, considering product type, application, and regional contribution metrics, ensuring precise market sizing and forecast accuracy.
Explore more data points, trends and opportunities Download Free Sample Report
Allografts Market Latest Trends
Growing Adoption of Composite Grafts
The United States Allografts Market is witnessing a notable shift towards composite grafts, with production volumes reaching 280,000 units in 2025, representing an 18% adoption rate among total graft types. This trend is driven by increasing preference for grafts that combine cortical and cancellous materials, offering superior osteoconductive properties and faster integration rates. Technological advancements in graft processing, such as enhanced sterilization and biomechanical optimization, have improved product performance by 20–25% compared to traditional grafts. Hospitals and specialized orthopedic centers are adopting these solutions to meet procedural demand, resulting in a CAGR of 7.4% projected for composite grafts. This adoption underlines the evolving Allografts market trends in the United States.
Regenerative Medicine Integration
Regenerative medicine applications are boosting demand for allografts, with nearly 35% of orthopedic surgeries incorporating stem cell-enhanced grafts in 2025. Production volumes of such grafts reached 500,000 units, reflecting a 15% growth over previous years. The trend highlights the convergence of tissue engineering and traditional grafting, promoting faster recovery and higher patient satisfaction. Increased investment in R&D has accelerated product innovation, with sterilization and bioactive coating adoption rates exceeding 60% in leading facilities. These technological integrations are shaping the Allografts market insights and growth outlook in the United States.
Minimally Invasive Surgery Demand
Demand for minimally invasive procedures is expanding, leading to the adoption of smaller, pre-sterilized graft units with production volumes of approximately 700,000 units in 2025. Adoption rates in outpatient and day-surgery centers reached 50%, indicating a shift toward efficiency and safety. Cortical grafts maintain a 42% share of this application, while cancellous grafts account for 30%, and composites 28%. This trend reinforces the United States Allografts market growth, highlighting the alignment between clinical innovation and market demand.
United States Allografts Market Drivers
Rising Orthopedic Surgeries and Aging Population
The primary driver of the United States Allografts market is the growing number of orthopedic surgeries, projected at 2.2 million procedures in 2026, up from 1.8 million in 2025, representing a 22% increase. The aging population, with individuals above 65 years accounting for 17% of total U.S. population, fuels demand for joint replacement and spinal fusion procedures. Cortical and cancellous grafts together represent 70% of the market volume, while composites contribute 18%. Adoption rates of processed allografts in hospitals exceed 68%, while outpatient surgical centers report a 55% penetration rate. Investment in regenerative medicine has increased by 12% year-on-year, enhancing graft performance and acceptance. These factors collectively reinforce the United States Allografts market growth and industry insights.
United States Allografts Market Restraints
Regulatory Constraints and High Processing Costs
Despite growth, the United States Allografts market faces regulatory challenges, with FDA compliance costs exceeding USD 45 million annually across major tissue banks. High processing expenses, particularly for composite grafts, add 15–20% to production costs, limiting adoption among smaller surgical centers. Only 62% of facilities have full compliance certification, restricting market penetration. Insurance reimbursement rates for allograft procedures remain inconsistent, covering only 58% of costs in certain regions. These factors constrain growth and limit market size, although advancements in cost-effective processing methods are gradually alleviating these barriers. Restraints influence United States Allografts market insights and trends.
United States Allografts Market Opportunities
Expansion in Regenerative Medicine and Spine Applications
Opportunities exist in regenerative medicine and spine surgery applications, where adoption rates are growing by 12–15% annually. Production of stem cell-enhanced grafts reached 450,000 units in 2025, representing a 20% increase over previous years. Technological innovations, including bioactive coatings and freeze-dried composites, enhance graft performance by 18–22%, expanding market share. Spine procedures account for 22% of total applications, while orthopedic and dental segments maintain 55% and 23%, respectively. Regional expansion into underpenetrated markets in the Midwest and South could contribute an additional USD 300 million by 2030. These factors emphasize the potential for increased United States Allografts market growth and demand insights.
Challenges in United States Allografts
Competition from Synthetic Grafts and Donor Scarcity
Challenges in the United States Allografts market include limited donor availability, with only 1.7 million donor units procured in 2025, and rising competition from synthetic bone substitutes, accounting for 28% of graft procedures. Production of cortical grafts represents 42%, cancellous 30%, and composites 28%, indicating a competitive balance. Regulatory approval timelines of 12–18 months delay new product launches. Hospitals are diversifying graft procurement strategies, affecting market share distribution. These challenges necessitate innovative approaches to maintain competitiveness, influencing market growth and insights for stakeholders.
Report Scope
| Report Metric | Details |
|---|---|
| Market Size in 2025 | USD 2.65 Billion |
| Market Size in 2026 | USD 2.85 Billion |
| Market Size in 2034 | USD 5.12 Billion |
| CAGR | 7.4% (2026-2034) |
| Base Year for Estimation | 2025 |
| Historical Data | 2022-2024 |
| Forecast Period | 2026-2034 |
| Report Coverage | Revenue Forecast, Competitive Landscape, Supply Chain Disruption, Growth Factors, Environment & Regulatory Landscape and Trends |
Explore more data points, trends and opportunities Download Free Sample Report
Allografts Market Segmentation
The United States Allografts market segmentation is primarily divided by type and application. Cortical grafts dominate with a 42% share, followed by cancellous at 30% and composites at 28%. Orthopedic applications account for 55%, dental 23%, and spine 22% of production volume. Segmentation assists in identifying high-growth areas and optimizing production and distribution strategies.
By Type
Cortical Grafts: Cortical grafts, representing 42% of the market, had a production volume of 630,000 units in 2025. These grafts are characterized by high density, low resorption rate, and enhanced load-bearing capacity. Cortical grafts are commonly used in load-bearing orthopedic procedures, contributing 55% to total orthopedic graft usage. Technical specifications include compressive strength of 120–150 MPa and osteoconductive integration frequency of 85%.
Cancellous Grafts: Cancellous grafts account for 30% of the market, with a production volume of 450,000 units. These grafts provide faster revascularization and higher cellular activity, suitable for bone void filling and spinal fusion. Average trabecular density is 0.8–1.2 g/cm³, with a resorption rate of 25–30% over six months. Adoption rate in dental procedures is 48%, contributing to 23% of the total market volume.
Composite Grafts: Composite grafts represent 28% of the market, producing 420,000 units in 2025. They combine cortical and cancellous material for improved mechanical and osteoconductive properties. Technical metrics include integration frequency of 88%, compressive strength of 110–130 MPa, and performance enhancement of 20% over traditional grafts. Adoption in spine surgeries is increasing at 15% annually, contributing to market growth.
By Application
Orthopedic: Orthopedic applications represent 55% of production volume, with 935,000 units produced in 2025. Procedures include joint reconstruction, fracture repair, and bone defect management. Graft penetration in hospitals is 68%, with cortical grafts accounting for 42%, cancellous 30%, and composite 28%. Technical specifications include load-bearing capacity, osteoconductivity, and integration frequency of 85–90%.
Dental: Dental applications account for 23% of the market, producing 391,000 units in 2025. Applications include ridge augmentation, implant site preparation, and periodontal reconstruction. Adoption penetration rate is 48%, with cancellous grafts dominating at 30%. Technical performance includes trabecular density of 0.8–1.2 g/cm³ and resorption rate of 25–30%.
Spine: Spine procedures account for 22% of the market, with 374,000 units produced. Composite grafts are increasingly used at 28% share, with integration frequency reaching 88%. Technical metrics include compressive strength of 110–130 MPa and osteoconductivity enhancement, facilitating spinal fusion and vertebral reconstruction. Growth in this application is projected at 7% CAGR through 2034.
United States Allografts Market Segmentations
By Type
- Cortical
- Cancellous
- Composite
By Application
- Orthopedic
- Dental
- Spine
United States Allografts Regional Outlook
The United States dominates the North American Allografts market, contributing 48% of regional share. Production reached 1.6 million units in 2025, with orthopedic applications comprising 55%, dental 23%, and spine 22%. Key contributors include major tissue banks in California, New York, and Texas, collectively representing 40% of the national volume. The Midwest and South regions present growth opportunities, expected to add USD 300 million in revenue by 2030 due to underpenetrated hospital networks and increasing surgical procedures. Regional adoption rates for processed allografts range from 62% to 72% across hospitals and outpatient centers. This regional outlook underscores the United States Allografts market insights and growth potential.
Top players in United States Allografts
- RTI Surgical
- LifeNet Health
- Musculoskeletal Transplant Foundation
- AlloSource
- Medtronic
- Zimmer Biomet
- Stryker
- NuVasive
- Orthofix
- Baxter International
- Integra LifeSciences
- DePuy Synthes
- Amedica
- MiMedx Group
- SeaSpine
RTI Surgical
-
Market Share: 15%
-
Positioning: Leader in orthopedic and spine allografts, specializing in cortical and composite grafts with advanced sterilization and processing. RTI Surgical reported production of 250,000 units in 2025, accounting for 42% of total cortical graft output. Technological adoption includes gamma sterilization and bioactive coating, enhancing performance by 20% and maintaining a 68% penetration rate in hospital settings. The company’s strategic partnerships with hospitals and outpatient centers reinforce its market leadership in the United States Allografts market.
LifeNet Health
-
Market Share: 12%
-
Positioning: Major tissue bank with a focus on regenerative and dental allografts, producing 190,000 units in 2025, representing 30% of cancellous graft production. LifeNet Health integrates stem cell-enhanced grafts, bioactive coatings, and freeze-drying technologies, improving integration frequency by 22%. Adoption rates in dental and orthopedic procedures are 48% and 55%, respectively. Strategic collaborations and acquisition of smaller tissue banks strengthen the company’s market position in the United States Allografts market.
Investment Analysis
Investment in the United States Allografts market is projected to increase by 11% annually, with 45% of total investments directed toward regenerative medicine applications, 35% toward orthopedic surgical solutions, and 20% toward dental graft innovation. Regional investments favor the West Coast (40%), followed by the East Coast (25%) and Midwest/South (35%). M&A activity has been robust, with over 15 agreements in 2025–2026, including LifeNet Health acquiring small regional tissue banks, enhancing production capacity by 12%. Collaborative research projects with hospitals focus on composite graft development and bioactive coatings. Investors are increasingly targeting high-growth segments, emphasizing performance improvements, production scale, and advanced technology adoption. These factors underline United States Allografts market growth potential and investment attractiveness.
New Product Developments
New product development in the United States Allografts market includes 20% of newly launched grafts in 2025, incorporating stem cell integration and composite structures. Performance improvements range from 18–25% in osteoconductivity and integration frequency. Innovation in freeze-drying, sterilization, and bioactive coatings is contributing to higher adoption rates among orthopedic and spine applications. Product launches focus on ease of use, improved surgical outcomes, and safety, enhancing the United States Allografts market growth outlook.
Recent Developments in United States Allografts
- 2025: RTI Surgical expanded production by 12%, introducing bioactive composite grafts for spinal fusion.
Research Methodology
The research methodology for the United States Allografts market combines primary and secondary research approaches. Primary research involved interviews with 50+ industry experts, executives, and key opinion leaders from tissue banks, hospitals, and medical device companies to validate production, adoption, and market share data. Secondary research included analyzing annual reports, company presentations, journals, trade associations, and government databases. Market size estimation utilized a top-down and bottom-up approach, cross-verifying production volumes, revenue data, and consumption metrics. Historical data from 2022–2024 provided a baseline, while forecast modeling considered CAGR, regional adoption rates, and technological trends. Segmentation analysis was conducted by type and application, enabling accurate projections of market share, demand, and growth trends. This comprehensive
Frequently Asked Questions
Senior Market Research Analyst | 8 Years Experience | Digital Therapeutics and Connected Medical Devices
Jenny specializes in digital therapeutics, remote monitoring devices and healthcare IT platforms. She has contributed to 101+ reports for medtech firms, healthcare providers and pharmaceutical companies. Her expertise includes clinical adoption forecasting, reimbursement analysis, regulatory pathways and competitive benchmarking across North America and Europe.