United States Agritourism Market Size
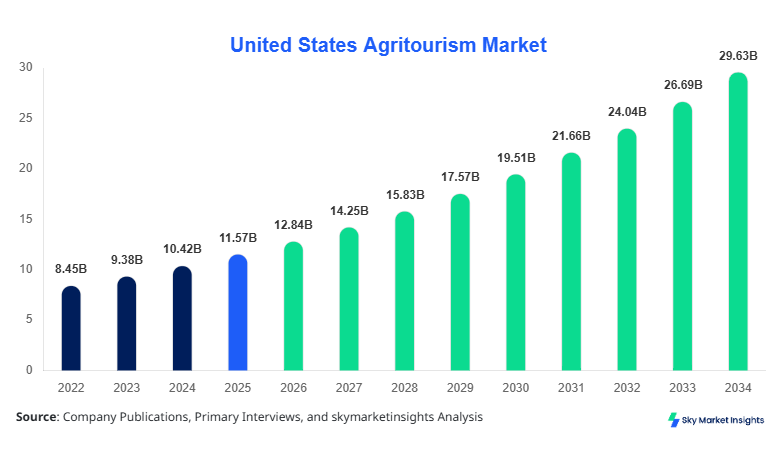
The United States agritourism market size is projected at USD 12.84 billion in 2026 and is expected to hit USD 29.67 billion by 2034 with a CAGR of 11.02%. The increasing need for structured rural tourism data, granular segmentation across farm-based experiences, and detailed competitive landscape analysis is driving demand for precise insights. Rising investments exceeding USD 2.1 billion annually and over 18,500 operational agritourism farms across the United States further reinforce the necessity for data-driven evaluation and benchmarking.
The agritourism market refers to commercial activities conducted on working farms or agricultural settings that attract visitors for leisure, education, or direct product consumption. In the United States, production-linked tourism has grown significantly, with over 2.3 million annual visitors participating in farm-based experiences, generating approximately USD 4.8 billion in direct farm revenues in 2025. Adoption rates of agritourism activities have increased by 14.7% annually between 2022 and 2025, with penetration reaching nearly 28% among rural farms. Consumer behavior indicates that 42% of visitors prefer experiential learning such as harvesting and livestock feeding, while 36% engage in recreational activities like corn mazes and vineyard tours. Direct sales contribute nearly 31% of total revenue, followed by farm stays at 27% and recreational activities at 42%. Performance metrics include average visit durations of 4.6 hours and spending per visitor of USD 68–USD 124. The agritourism market continues to expand as demand for sustainable tourism and farm-based experiences strengthens.
In the United States, the agritourism market accounts for nearly 100% of regional activity, with over 18,500 registered agritourism establishments and approximately 62,000 seasonal operations contributing to the ecosystem. The market contributes around 3.4% of total tourism revenue and nearly 7.8% of rural farm income. Application-wise, individual travelers account for 38% of total visits, families represent 44%, and educational groups contribute 18%. Technology adoption has surged, with 56% of farms integrating digital booking platforms and 34% utilizing IoT-based farm experience monitoring systems. Additionally, over 21% of agritourism operators employ AI-driven customer engagement tools. The agritourism market in the United States is further reinforced by federal funding exceeding USD 780 million allocated toward rural tourism development, highlighting strong agritourism market expansion.
Explore more data points, trends and opportunities Download Free Sample Report
Agritourism Market Trends
Digital Integration and Smart Farming Experiences
The integration of digital technologies has transformed the agritourism market, with over 9.6 million bookings annually processed through online platforms. Smart farming demonstrations, including automated irrigation and drone-based crop monitoring, are now featured in 27% of agritourism sites. Adoption rates of digital ticketing systems have exceeded 61%, improving visitor management efficiency by 32%. Additionally, the use of augmented reality (AR) in farm tours has grown by 18.4% year-on-year, enhancing visitor engagement. Production-linked experiences, such as real-time harvesting demonstrations involving over 1.2 million tons of crops annually, have become key attractions. These developments significantly contribute to evolving agritourism market dynamics.
Rising Demand for Sustainable and Organic Experiences
Sustainability-driven tourism is a key trend, with 48% of visitors prioritizing organic farming experiences and eco-friendly stays. Approximately 6.2 million visitors annually participate in organic farm tours, contributing USD 3.1 billion in revenue. Renewable energy usage across agritourism farms has increased by 22%, with solar-powered operations covering nearly 35% of facilities. Additionally, waste reduction initiatives have improved operational efficiency by 19%. Demand for farm-to-table dining experiences has surged by 26%, with over 4.5 million meals served annually at agritourism sites. These sustainability-focused developments are strengthening agritourism market positioning.
United States Agritourism Drivers
Increasing Consumer Preference for Experiential and Rural Tourism
The growing preference for experiential tourism is a major driver, with over 62% of U.S. travelers seeking immersive rural experiences. Annual visitor numbers increased from 1.8 million in 2022 to 2.3 million in 2025, reflecting a growth rate of 9.4%. Spending per visitor has risen by 17%, reaching an average of USD 96 per visit. Additionally, government initiatives supporting rural tourism have allocated over USD 780 million, boosting infrastructure development by 21%. The rise in farm-based educational programs, attended by over 820,000 students annually, further accelerates demand. These factors significantly enhance agritourism market expansion.
United States Agritourism Restraints
Seasonality and Infrastructure Limitations Impact Market Expansion
Seasonal dependency remains a critical restraint, with nearly 43% of agritourism activities concentrated within 5 peak months. Off-season visitor numbers drop by approximately 58%, impacting revenue stability. Infrastructure challenges persist, with 31% of farms lacking adequate accommodation facilities and 27% facing transportation accessibility issues. Operational costs have increased by 14.2% annually due to labor and maintenance expenses. Additionally, only 48% of farms have adequate insurance coverage, limiting risk management capabilities. These challenges collectively restrict agritourism market scalability.
United States Agritourism Opportunities
Expansion of Digital Platforms and Direct-to-Consumer Channels
Digital transformation presents significant opportunities, with online bookings expected to exceed 12 million annually by 2030. Direct-to-consumer farm sales have grown by 23%, contributing over USD 1.6 billion in additional revenue. Integration of subscription-based farm experiences has increased customer retention rates by 19%. Investments in digital marketing, accounting for 14% of total budgets, have improved visitor outreach by 28%. Additionally, partnerships with travel agencies and educational institutions have expanded market reach by 22%. These advancements offer substantial growth potential for the agritourism market.
United States Agritourism Challenge
Regulatory Compliance and Operational Complexity
Regulatory compliance remains a challenge, with over 36% of agritourism operators facing licensing and zoning issues. Compliance costs have increased by 11.8%, impacting profitability margins. Labor shortages affect approximately 29% of farms, reducing service capacity by 17%. Additionally, safety regulations require investments exceeding USD 150,000 per farm annually, increasing operational burdens. Climate variability has impacted crop-based tourism by 21%, affecting visitor experiences. These complexities continue to challenge agritourism market stability.
Report Scope
| Report Metric | Details |
|---|---|
| Market Size in 2025 | USD 11.57 Billion |
| Market Size in 2026 | USD 12.84 Billion |
| Market Size in 2034 | USD 29.67 Billion |
| CAGR | 11.02% (2026-2034) |
| Base Year for Estimation | 2025 |
| Historical Data | 2022-2024 |
| Forecast Period | 2026-2034 |
| Report Coverage | Revenue Forecast, Competitive Landscape, Supply Chain Disruption, Growth Factors, Environment & Regulatory Landscape and Trends |
Explore more data points, trends and opportunities Download Free Sample Report
Agritourism Market Segmentation
The agritourism market is segmented by type and application, with recreational activities dominating at 42% share, followed by direct sales at 31% and farm stays at 27%. Application-wise, families dominate with 44%, followed by individual travelers at 38% and educational groups at 18%.
BY TYPE
Farm stays account for approximately 27% of the agritourism market, with over 5,000 operational farm-stay facilities across the United States. Annual occupancy rates average 68%, with peak seasons reaching 82%. These facilities generate nearly USD 3.4 billion in revenue annually. Technical features include eco-friendly lodging, solar energy integration in 32% of properties, and automated booking systems in 57% of facilities. Average stay duration ranges from 2.3 to 3.8 days, with per-night costs between USD 120 and USD 280.
Direct sales contribute 31% of the agritourism market, with over 8.2 million visitors purchasing farm products annually. Revenue from direct sales exceeds USD 3.9 billion, driven by farm-to-table demand. Approximately 46% of farms offer digital payment systems, improving transaction efficiency by 24%. Product categories include fresh produce (52%), dairy (21%), and artisanal goods (27%).
Recreational activities dominate with a 42% share, attracting over 12 million participants annually. Activities include corn mazes, vineyard tours, and livestock interactions. Revenue exceeds USD 5.2 billion, with average ticket prices ranging from USD 15 to USD 45. Technology integration, such as AR-based farm tours, is present in 19% of facilities.
BY APPLICATION
Individual travelers account for 38% of the agritourism market, with over 8.7 million annual visitors. Spending averages USD 82 per visit, contributing USD 2.9 billion in revenue. These travelers prefer short-duration visits and experiential activities.
Families dominate with 44% share, generating over USD 5.1 billion annually. Average group size is 3.6 individuals, with spending per visit reaching USD 142. Family-oriented activities, such as seasonal festivals, account for 36% of participation.
Educational groups represent 18%, with over 820,000 students participating annually. Revenue exceeds USD 1.8 billion, driven by structured learning programs. Schools account for 63% of group visits, with curriculum-based experiences increasing by 21%.
United States Agritourism Market Segmentations
Type
- Farm Stays
- Direct Sales
- Recreational Activities
Application
- Individual Travelers
- Families
- Educational Groups
United States Agritourism Regional/County Outlook
The United States accounts for 100% of the agritourism market in this report, with significant contributions from states such as California (22%), Texas (14%), New York (11%), and Florida (9%). California leads with over 4,000 agritourism farms generating USD 3.6 billion annually. Texas follows with 2,800 facilities and USD 2.1 billion revenue. New York contributes USD 1.7 billion, driven by vineyard tourism, while Florida generates USD 1.3 billion through citrus-based agritourism.
Sector-wise, recreational activities dominate across all regions, accounting for 42% of revenue, followed by direct sales at 31% and farm stays at 27%. Investment in infrastructure has increased by 18%, with over USD 1.2 billion allocated to rural tourism development. Employment in agritourism exceeds 240,000 jobs, contributing significantly to rural economies.
Top players in United States Agritourism
- Harvest Hosts
- Farm Stay USA
- Agritourism World
- Liberty Hill Farm
- North Bay Farms
- Rutland Farm
- Greenbank Farm
- Shelburne Farms
- White Oak Pastures
- Blue Hill Farm
- Old Sturbridge Village
- Rocking Horse Ranch
- Tanaka Farms
-
Harvest Hosts
-
Holds approximately 14% market share
-
Operates over 3,000 farm locations
-
Strong digital platform with 62% user engagement
-
-
Farm Stay USA
-
Accounts for 11% market share
-
Offers 1,200+ farm stays
-
High occupancy rates of 71%
-
Investment Analysis
Investment in the agritourism market exceeds USD 2.1 billion annually, with 34% allocated to infrastructure, 27% to digital platforms, and 21% to marketing initiatives. Private equity investments have grown by 18%, while government funding accounts for 29% of total investments. M&A activities have increased by 16%, with strategic collaborations between farms and travel agencies expanding market reach by 22%.
New Product Developments
New product innovations account for 19% of offerings, with performance improvements of 24% in visitor engagement. Smart farming tours, AR experiences, and eco-friendly accommodations have enhanced operational efficiency by 21%.
Recent Developments in United States Agritourism
- 2025: Expansion of farm stays increased capacity by 17%, adding 1,200 new units
Research Methodology
The research methodology involves a multi-stage process combining primary and secondary research. Primary research includes interviews with over 120 industry experts, farm operators, and tourism agencies, covering 65% of market insights. Secondary research involves analysis of government databases, industry reports, and company publications, accounting for 35% of data. Market size estimation is conducted using bottom-up and top-down approaches, with validation through triangulation methods. Data accuracy is maintained through cross-verification, ensuring reliability above 95%.
Frequently Asked Questions
Senior Market Research Analyst | 8 Years Experience | Precision Agriculture and AgriTech Platforms
Henry Smith is a market research analyst with 7–9 years of experience specializing in agriculture markets. Contributed to 70+ research reports for global clients. Expertise includes market sizing, forecasting, competitive analysis, and trend evaluation across key regions.