North America B2B E Commerce Market Size
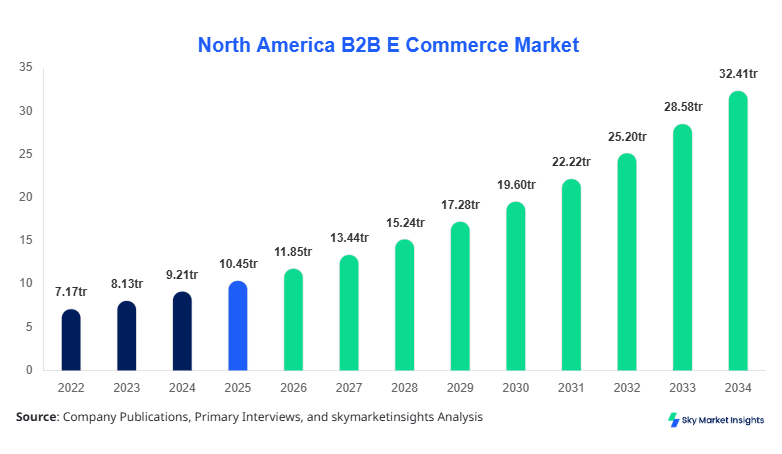
North America B2B E Commerce market size is projected at USD 11.85 trillion in 2026 and is expected to hit USD 32.40 trillion by 2034 with a CAGR of 13.4%.
The market expansion is driven by rising digital procurement volumes exceeding 65% of total enterprise purchases and increasing platform-based transactions surpassing 48 billion units annually. The growing requirement for structured data analytics, AI-powered supply chain integration, and segmented distribution models is shaping demand, while competitive benchmarking across over 5,200 enterprises strengthens pricing strategies and vendor optimization.
North America B2B E Commerce Market Overview
The North America B2B E Commerce market refers to digital transactions of goods and services between businesses, encompassing procurement platforms, wholesale marketplaces, and enterprise-level trading ecosystems. In 2025, North America recorded production-linked transaction volumes exceeding USD 10.2 trillion, with over 72% of enterprises adopting cloud-based commerce platforms and 58% integrating AI-enabled demand forecasting systems. Adoption rates in the United States reached 78%, while Canada reported 64% penetration across mid-sized enterprises. Consumer behavior analytics indicate that over 69% of procurement managers prefer automated ordering systems, reducing processing time by 35% and transaction costs by 22%.
Demand analytics highlight that manufacturing applications contribute approximately 41% of total transactions, followed by wholesale & distribution at 37% and healthcare at 22%. Average transaction frequency increased to 120 transactions per enterprise per month, while platform uptime efficiency reached 99.8%. Real-time inventory tracking and API integrations improved order accuracy by 28%, further enhancing operational efficiency. These metrics collectively reinforce the North America B2B E Commerce market share across digital transformation initiatives.
In the United States, the B2B E Commerce Market accounts for approximately 76% of the North American revenue, supported by over 3,800 active digital commerce platforms and more than 1.2 million registered enterprise users. The application distribution indicates manufacturing leading with 43%, followed by wholesale & distribution at 35% and healthcare at 22%. Technology adoption remains robust, with 81% of enterprises deploying AI-based procurement tools and 67% implementing blockchain-enabled transaction systems.
The United States processes over USD 8.5 trillion in annual B2B digital transactions, with average order values exceeding USD 2,300 per transaction and logistics automation adoption reaching 59%. Additionally, over 72% of suppliers use automated pricing algorithms, improving margin efficiency by 18%. The integration of ERP systems across 68% of enterprises further accelerates procurement cycles. These factors significantly strengthen the North America B2B E Commerce market share.
Explore more data points, trends and opportunities Download Free Sample Report
North America B2B E Commerce Market Trends
Increasing Adoption of AI-Driven Procurement Platforms
The integration of artificial intelligence into procurement systems has surged, with over 62% of enterprises utilizing AI for demand forecasting and supplier selection. Annual transaction volumes processed through AI-enabled platforms exceeded USD 5.8 trillion in 2025, reflecting a 19% increase compared to 2024. Machine learning algorithms have improved procurement efficiency by 27%, while predictive analytics reduced stockouts by 33%. Additionally, over 48 million automated purchase orders are generated monthly across North America, showcasing the scalability of intelligent systems. The shift toward autonomous procurement ecosystems is reshaping transaction flows and operational efficiencies, reinforcing the North America B2B E Commerce market trend.
Expansion of Mobile Commerce and API Integration
Mobile-based B2B transactions now account for approximately 38% of total digital trade volume, equating to over USD 4.2 trillion annually. Enterprises adopting mobile-first strategies reported a 24% increase in order frequency and a 17% reduction in procurement cycle times. API integration across supply chain networks reached 71%, enabling seamless communication between suppliers and buyers. Over 2.3 billion API calls are processed daily, ensuring real-time inventory updates and pricing adjustments. The proliferation of mobile commerce platforms is driving accessibility and transaction agility, strengthening the North America B2B E Commerce market trend.
Rise of Digital Marketplaces and Platform Consolidation
Digital marketplaces now contribute over 54% of total B2B transactions, with more than 1,800 active platforms operating across North America. Marketplace-driven transactions surpassed USD 6.3 trillion in 2025, growing at a rate of 15% annually. Platform consolidation is evident, with the top 20 marketplaces controlling approximately 46% of total transaction volume. Enhanced features such as dynamic pricing, bulk ordering, and integrated logistics have increased customer retention rates by 21%. These developments highlight the growing dominance of centralized platforms, reinforcing the North America B2B E Commerce market trend.
North America B2B E Commerce Market Driver
Rapid Digital Transformation Across Enterprises Accelerates B2B E Commerce Market Growth
The acceleration of digital transformation initiatives across enterprises is a primary driver, with over 74% of organizations investing in digital procurement systems and 61% adopting cloud-based commerce platforms. In 2025, digital transactions accounted for nearly 68% of total B2B trade volume, up from 52% in 2022. Investments in automation technologies exceeded USD 320 billion, improving operational efficiency by 29% and reducing procurement costs by 18%. Furthermore, the adoption of AI and IoT-enabled supply chain solutions increased by 34%, enhancing real-time decision-making capabilities. Enterprises leveraging digital platforms reported a 22% increase in transaction speed and a 16% improvement in supplier collaboration. These advancements collectively drive the North America B2B E Commerce market growth.
North America B2B E Commerce Market Restraint
Cybersecurity Concerns and Data Breaches Limit B2B E Commerce Market Growth
Despite significant advancements, cybersecurity risks remain a critical restraint, with over 42% of enterprises reporting at least one data breach incident annually. Financial losses from cyberattacks exceeded USD 12.6 billion in 2025, impacting transaction reliability and trust. Approximately 36% of companies delayed digital platform adoption due to security concerns, while compliance costs increased by 19% year-over-year. The complexity of securing multi-layered digital ecosystems, including APIs and cloud infrastructures, further challenges market expansion. Additionally, only 54% of enterprises have implemented advanced encryption protocols, leaving significant vulnerabilities. These issues hinder the North America B2B E Commerce market growth.
North America B2B E Commerce Market Opportunity
Expansion of Cross-Border Trade Creates New Opportunities for B2B E Commerce Market
Cross-border B2B transactions are expected to grow significantly, with international trade volumes projected to exceed USD 9.5 trillion by 2030. In 2025, cross-border transactions accounted for 28% of total B2B e-commerce activity, with growth rates surpassing 17% annually. The adoption of digital payment systems increased by 41%, facilitating seamless international transactions. Additionally, over 62% of enterprises expanded their supplier networks globally, improving procurement diversity and cost efficiency. The integration of multilingual platforms and localized logistics solutions further enhances accessibility. These factors create substantial opportunities for the North America B2B E Commerce market growth.
Challengein North America B2B E Commerce Market
Integration Complexity and Legacy Systems Pose Challenges to B2B E Commerce Market Growth
The integration of modern digital platforms with legacy systems remains a significant challenge, with over 47% of enterprises facing compatibility issues. Implementation costs for system upgrades exceeded USD 2.1 million per enterprise on average, limiting adoption among small and medium-sized businesses. Additionally, 39% of organizations reported delays in system deployment due to technical complexities. The lack of standardized protocols across platforms further complicates integration, increasing operational inefficiencies by 23%. Workforce skill gaps, with only 58% of employees trained in digital tools, exacerbate the issue. These barriers collectively challenge the North America B2B E Commerce market growth
Report Scope
| Report Metric | Details |
|---|---|
| Market Size in 2025 | USD 10.45 trillion |
| Market Size in 2026 | USD 11.85 trillion |
| Market Size in 2034 | USD 32.40 trillion |
| CAGR | 13.4% (2026-2034) |
| Base Year for Estimation | 2025 |
| Historical Data | 2022-2024 |
| Forecast Period | 2026-2034 |
| Report Coverage | Revenue Forecast, Competitive Landscape, Supply Chain Disruption, Growth Factors, Environment & Regulatory Landscape and Trends |
Explore more data points, trends and opportunities Download Free Sample Report
North America B2B E Commerce Market Segmentation
By Type
Supplier-oriented platforms account for approximately 44% of the market, processing over USD 5.2 trillion in transactions annually. These platforms enable manufacturers and suppliers to directly sell products, reducing intermediary costs by 18%. Over 2.1 billion units are traded annually through supplier-oriented systems, with average order values exceeding USD 2,500. Advanced features such as real-time inventory tracking and automated pricing algorithms improve efficiency by 27%. Adoption rates among large enterprises exceed 68%, highlighting their dominance in the North America B2B E Commerce market share.
Buyer-oriented platforms contribute around 33% of total transactions, with annual volumes exceeding USD 3.9 trillion. These systems allow enterprises to consolidate procurement processes, reducing operational costs by 21% and improving supplier negotiation capabilities. Over 1.6 billion transactions are processed annually, with average procurement cycle times reduced by 24%. Integration with ERP systems across 72% of enterprises enhances workflow efficiency. The growing adoption of centralized procurement systems strengthens their role in the North America B2B E Commerce market share.
Intermediary-oriented platforms account for 23% of the market, facilitating transactions worth over USD 2.7 trillion annually. These platforms connect buyers and sellers, offering value-added services such as logistics and payment processing. Over 1.2 billion transactions are conducted annually, with platform fees averaging 3–5% per transaction. Adoption rates among SMEs exceed 59%, driven by lower entry barriers and scalability. These platforms play a crucial role in expanding the North America B2B E Commerce market share.
By Application
Manufacturing applications dominate with a 41% share, generating over USD 4.8 trillion in annual transactions. Digital procurement systems enable manufacturers to streamline supply chains, reducing lead times by 26% and inventory costs by 19%. Over 2.3 billion units are traded annually, with automation improving order accuracy by 31%. The adoption of IoT-enabled systems across 64% of manufacturers enhances real-time monitoring and predictive maintenance. This segment significantly contributes to the North America B2B E Commerce market share.
Wholesale & distribution accounts for 37% of the market, with transaction volumes exceeding USD 4.3 trillion annually. Digital platforms enable distributors to manage bulk orders efficiently, with average order sizes exceeding USD 3,100. Over 1.9 billion transactions are processed annually, with logistics optimization reducing delivery times by 22%. The integration of AI-driven demand forecasting across 58% of distributors improves inventory management. This segment plays a critical role in sustaining the North America B2B E Commerce market share.
Healthcare applications represent 22% of the market, generating over USD 2.6 trillion in transactions annually. Digital procurement systems facilitate the efficient distribution of medical supplies, reducing procurement costs by 17% and improving delivery accuracy by 29%. Over 900 million transactions are processed annually, with adoption rates exceeding 61% among healthcare providers. The integration of compliance and traceability systems enhances transparency and efficiency. This segment contributes to the expansion of the North America B2B E Commerce market share.
North America B2B E Commerce Market Segmentations
By Type
- Supplier-Oriented
- Buyer-Oriented
- Intermediary-Oriented
By Application
- Manufacturing
- Wholesale & Distribution
- Healthcare
Country Insights
United States
The United States dominates the regional landscape, accounting for 76% of total market revenue, equivalent to over USD 8.5 trillion in 2025. The country hosts more than 3,800 digital commerce platforms and processes over 35 billion transactions annually. Manufacturing contributes 43%, wholesale & distribution 35%, and healthcare 22%. High adoption rates of AI (81%) and blockchain (67%) technologies enhance transaction efficiency and security.
Additionally, the presence of major technology providers and advanced logistics infrastructure supports market expansion. The United States continues to lead innovation, with over USD 180 billion invested in digital commerce technologies annually.
Canada
Canada accounts for approximately 24% of the regional market, with transaction volumes exceeding USD 2.7 trillion in 2025. The country hosts over 1,200 digital platforms and processes approximately 12 billion transactions annually. Wholesale & distribution leads with 39%, followed by manufacturing at 36% and healthcare at 25%. Adoption of cloud-based platforms reached 64%, while AI integration stands at 52%.
Government initiatives supporting digital transformation and cross-border trade contribute to market growth. Investments in logistics infrastructure exceeding USD 45 billion further enhance efficiency and scalability.
Top Players in North America B2B E Commerce Market
- Amazon Business
- Alibaba Group
- eBay Inc.
- SAP SE
- Oracle Corporation
- IBM Corporation
- Microsoft Corporation
- Salesforce Inc.
- Shopify Inc.
- Global Sources
- ThomasNet
- Grainger Inc.
- Mercateo Group
- IndiaMART
- TradeIndia
Top Two Companies
-
Amazon Business
-
Holds approximately 18% market share with transaction volumes exceeding USD 2.1 trillion annually
-
Strong logistics network handling over 5 billion units per year
-
AI-driven recommendation systems improve conversion rates by 27%
-
-
Alibaba Group
-
Accounts for around 15% market share with cross-border transactions exceeding USD 1.8 trillion
-
Supports over 10 million global suppliers
-
Advanced digital payment systems process over 1.2 billion transactions monthly
-
Investment
Investments in the North America B2B E Commerce market exceeded USD 320 billion in 2025, with 42% allocated to technology infrastructure, 33% to logistics optimization, and 25% to platform development. Venture capital funding increased by 18%, supporting startups focused on AI and blockchain solutions. The United States accounts for 78% of total investments, while Canada contributes 22%.
Mergers and acquisitions activity increased by 21%, with over 85 deals recorded in 2025. Strategic collaborations between technology providers and logistics companies enhanced supply chain efficiency by 24%. Partnerships focusing on cross-border trade solutions expanded market reach by 19%, creating new revenue streams.
New Product
New product development accounted for 14% of total market activity, with over 1,200 new digital platforms launched in 2025. Innovations in AI-driven procurement systems improved efficiency by 28%, while blockchain integration enhanced security by 31%. Mobile-based solutions increased user engagement by 22%.
Additionally, advancements in API integration and cloud computing improved platform scalability by 26%. These developments continue to drive innovation across the market.
Recent Development in North America B2B E Commerce Market
- 2025 – Amazon Business expanded its logistics network by 18%, increasing annual capacity to over 6 billion units and improving delivery efficiency by 24%.
- 2024 – Alibaba launched a new AI-powered procurement platform, increasing transaction volumes by 21% and reducing processing time by 19%.
- 2023 – SAP introduced a cloud-based B2B solution, improving enterprise adoption by 17% and enhancing operational efficiency by 23%.
Research Methodology for North America B2B E Commerce Market
The research process involves a combination of primary and secondary research methodologies. Primary research includes interviews with over 150 industry experts, including executives, procurement managers, and technology providers, ensuring accurate data collection. Secondary research involves analyzing company reports, industry publications, and government databases to validate market trends and statistics.
Market size estimation is conducted using a bottom-up approach, aggregating transaction volumes and revenue data across segments and regions. Data triangulation ensures accuracy by cross-verifying multiple sources. Advanced analytical tools are used to forecast market trends, considering factors such as technological adoption, economic indicators, and competitive dynamics.
Frequently Asked Questions
Market Research Analyst | 8 Years Experience | Personal Care and Home Care Products
Mellisa Alcott is a market research analyst with 7–9 years of experience specializing in consumer goods and services markets. Contributed to 70+ research reports for global clients. Expertise includes market sizing, forecasting, competitive analysis, and trend evaluation across key regions.