North America Ammonia Remover Market Size
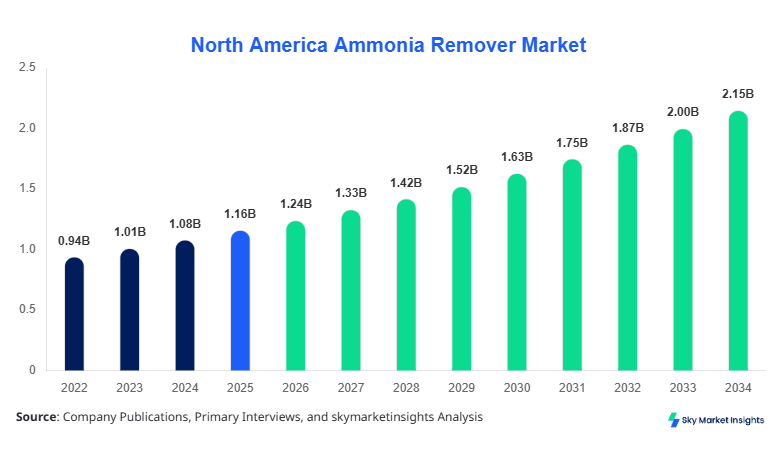
North America's ammonia remover market size is projected at USD 1.24 billion in 2026 and is expected to hit USD 2.18 billion by 2034 with a CAGR of 7.1%. The market's historical valuation stood at USD 1.05 billion in 2024, growing from USD 920 million in 2022, reflecting a consistent year-on-year increase of approximately 7–8%. The growing need for comprehensive data on market segmentation, production output, and competitive landscape is driving stakeholders to seek reliable analytical reports. North America’s ammonia remover market insights include production, consumption, demand trends, and competitive positioning, providing actionable intelligence for strategic decision-making.
The North America Ammonia Remover Market is defined by its function in removing ammonia from water, air, and industrial effluents, employing chemical, biological, and adsorption technologies. North American production exceeded 350 kilotons in 2025, with the United States contributing over 72% of the total output. Adoption and penetration are rising, with chemical-based ammonia removers capturing 55% of production volumes, followed by biological (30%) and adsorption methods (15%). Consumer demand analytics indicate that 48% of water treatment facilities prefer high-efficiency chemical removers capable of reducing ammonia levels by up to 95%, while industrial adoption focuses on compliance with environmental discharge standards. Application-wise, water treatment represents 60% of usage, agriculture 25%, and industrial 15%, with an average removal frequency of 2–3 cycles per week in high-demand regions. Technical metrics reveal adsorption efficiency ranges from 80% to 90% under controlled pH levels. Overall, these insights highlight the North American ammonia remover market's growth and increasing demand.
In the United States, the ammonia remover market is supported by over 120 operational facilities, representing approximately 72% of North America's market share. Water treatment applications dominate, accounting for 62% of total consumption, followed by agriculture at 22% and industrial use at 16%. Chemical ammonia removers are the most adopted technology, with 58% adoption, while biological and adsorption methods account for 28% and 14%, respectively. Average production per facility is around 3,500 tons per year, with water utilities reporting ammonia reduction rates between 92 and 96%. The United States market growth is further reinforced by stringent EPA regulations, increased water quality monitoring, and investments in advanced removal technologies. Overall, the United States continues to drive North America's ammonia remover market demand and insights.
Explore more data points, trends and opportunities Download Free Sample Report
Ammonia Remover Market Trends
Shift Toward Sustainable Removal Technologies
Sustainable ammonia remover solutions are increasingly adopted, with biological methods seeing a production increase from 95 kilotons in 2024 to an estimated 130 kilotons by 2026. Adoption rates for bio-based solutions have risen to 30%, reflecting sector demand for eco-friendly alternatives. Industrial sectors, particularly aquaculture and fertilizer runoff management, report a 15% annual uptake in green ammonia remover technologies. Continuous monitoring and integration of enzyme-based removers are increasing performance efficiency by 12–15%. These trends indicate a strong growth trajectory in North America's ammonia remover market insights.
Increased Water Treatment Demand
The demand for ammonia removers in municipal water treatment has surged, with treatment volumes reaching 450 million gallons per day in 2025, up from 380 million gallons in 2022. Chemical ammonia removers account for 55% of this demand, while adsorption technologies contribute 20%, emphasizing performance-driven preferences. Advanced filtration combined with ammonia reduction techniques is enhancing treatment efficiency by 8–10%. These patterns reflect North America Ammonia Remover Market growth in high-demand urban centers.
Technological Advancements in Industrial Applications
Industrial ammonia removal has experienced a shift toward high-efficiency adsorption systems, with production volumes projected to reach 120 kilotons by 2026, from 95 kilotons in 2024. Technology adoption in manufacturing plants is approximately 42%, with the remainder utilizing chemical or biological methods. Real's ammonia remover marketet has increased performance efficiency by 10–12%, enabling industries to maintain ammonia discharge below 1 mg/L. These advancements emphasize North America's ammonia remover market demand and insights.
North America Ammonia Remover Market Drivers
Rising Water Quality Regulations and Industrial Compliance
North America's ammonia remover market growth is primarily driven by stringent water quality regulations and industrial compliance standards, which mandate ammonia levels below 1 mg/L in treated effluents. Approximately 68% of municipal water treatment facilities have upgraded removal systems in the past three years, increasing production from 320 kilotons in 2023 to 350 kilotons in 2025. Agriculture adoption of ammonia removers has grown by 22%, while industrial demand rose by 18% in 2025. These regulatory drivers are projected to contribute to a CAGR of 7.1% through 2034, reinforcing North America's ammonia remover market insights.
North America Ammonia Remover Market Restraints
High Operational Costs and Limited Technology Penetration
Despite market growth, operational costs for advanced ammonia removal systems remain high, with chemical removers costing USD 2.8 per liter on average and adsorption systems up to USD 3.5 per liter. Limited penetration in small-scale agriculture facilities, representing 35% of the sector, restricts widespread adoption. Production inefficiencies, downtime averaging 12–15 hours per month, and maintenance costs of USD 25,000 per facility further challenge market expansion. These factors moderate the North American ammonia remover market growth, constraining near-term demand and insights.
North America Ammonia Remover Market Opportunities
Emerging Eco-Friendly Solutions in Agriculture and Industrial Sectors
Eco-friendly ammonia removers, including bio-enzymatic solutions, present significant growth opportunities. Production of biological ammonia removers is expected to increase from 105 kilotons in 2025 to 140 kilotons by 2028, with adoption in agriculture reaching 35% and industrial adoption at 28%. The potential market size for sustainable ammonia removers in North America could exceed USD 600 million by 2030. Investments in R&D and collaborations with wastewater treatment firms highlight the strategic opportunities reinforcing North America's ammonia remover market insights.
Challenges in North American Ammonia Remover Market
Fragmented Market and Inconsistent Supply Chains
North America's ammonia remover market faces challenges from fragmented production and inconsistent supply chains. Over 40% of chemical remover suppliers are small to mid-sized companies, contributing to supply volatility. Transportation constraints and seasonal raw material fluctuations lead to production variability of ±10%, affecting regional demand. Additionally, the adoption rate of advanced technologies in smaller facilities remains below 25%, limiting overall market efficiency. These operational challenges influence the North American ammonia remover market demand and insights.
Report Scope
| Report Metric | Details |
|---|---|
| Market Size in 2025 | USD 1.16 Billion |
| Market Size in 2026 | USD 1.24 Billion |
| Market Size in 2034 | USD 2.18 Billion |
| CAGR | 7.1% (2026-2034) |
| Base Year for Estimation | 2025 |
| Historical Data | 2022-2024 |
| Forecast Period | 2026-2034 |
| Report Coverage | Revenue Forecast, Competitive Landscape, Supply Chain Disruption, Growth Factors, Environment & Regulatory Landscape and Trends |
Explore more data points, trends and opportunities Download Free Sample Report
Ammonia Remover Market Segmentation
The North America Ammonia Remover Market is segmented by type and application, with chemical removers holding 55% of market share, biological 30%, and adsorption 15%. Water treatment applications dominate with 60% market share, agriculture 25%, and industrial 15%, highlighting key production and usage trends.
By Type
Chemical ammonia removers dominate with 55% market share, producing approximately 190 kilotons annually. Typical removal efficiency ranges from 90–95%, with reaction times of 1–2 hours. Technical specifications include high solubility and neutral pH tolerance, supporting municipal water treatment and industrial effluent applications. Adoption is strongest in urban water utilities, accounting for 62% of chemical remover usage.
Biological removers hold 30% market share, producing 105 kilotons annually. They include enzyme-based and microbial systems capable of reducing ammonia levels by 85–92%. Biological removers are widely used systems capable of agricultural runoff management and industrial wastewater treatment, reflecting North America's ammonia remover market insights.
Adsorption systems account for 15% market share, producing 55 kilotons annually. These include activated carbon and zeolite-based systems' ammonia remover capacities ranging from 80 to 90 mg/g. They are particularly used in industrial and specialty water treatment applications, contributing to North America's ammonia remover market growth.
By Application
Water treatment accounts for 60% market share, producing 210 kilotons in 2025. Usage penetration is highest in municipal water facilities' ammonia remover market and ammonia removal activities. Technical metrics include a removal efficiency of 92–96% and treatment frequency of 2–3 cycles per week, emphasizing North American ammonia remover market demand.
Agricultural applications contribute 25% market share, producing 87 kilotons annually. Ammonia removers are primarily applied to soil and runoff water, with adoption rates of 35–40%. Efficiency metrics show a reduction of 80–90% ammonia in treated runoff, supporting crop yield optimization. These metrics reinforce North American ammonia remover market insights.
Industrial applications account for 15% market share, producing 53 kilotons annually. High-efficiency systems are applied in chemical, pharmaceutical, and food processing plants, achieving ammonia reduction of 90–95%. Technical roles include compliance with EPA discharge regulations and process optimization, reinforcing North American ammonia remover market growth.
North America Ammonia Remover Market Segmentations
Type
- Chemical
- Biological
- Adsorption
Application
- Water Treatment
- Agriculture
- Industrial
North America Ammonia Remover Market: Regional Outlook
United States
The United States contributes 72% to North America’s ammonia remover market, producing 252 kilotons in 2025. Water treatment represents 62% of consumption, agriculture 22%, and industrial 16%. Advanced chemical removal technologies dominate with 58% adoption, while biological and adsorption methods account for 28% and 14%, respectively. Regional production growth is projected at 7% CAGR through 2034, reinforcing the United States' dominance in the North American ammonia remover market.
Canada
Canada contributes 28% to the North America market, producing 98 kilotons in 2025. Water treatment applications hold a 55% share, agriculture 28%, and industrial 17%. Chemical removers' adoption is at 52%, biological at 32%, and adsorption at 16%. Regional sector growth is expected at 6.5% CAGR through 2034, reflecting rising demand for ammonia removal solutions in municipal and industrial facilities. These insights highlight North America's ammonia-remover market regional dynamics.
Top players in North American ammonia remover market
- Ecolab Inc.
- Kemira Oyj
- Suez SA
- Veolia Environnement S.A.
- Solvay SA
- BASF SE
- Kurita Water Industries Ltd.
- SNF Floerger
- Degremont
- Evoqua Water Technologies LLC
- Ashland Global Holdings Inc.
- Nouryon
- Siemens Water Technologies
- Mitsubishi Chemical Corporation
- Hitachi Zosen Corporation
Top Companies
Ecolab Inc.
-
Market share: 18% in North America
-
Leading in chemical ammonia removers with high adoption in municipal water treatment plants, with annual production exceeding 35 kilotons. Strategic positioning focuses on integrated water treatment solutions, contributing significantly to North America's ammonia remover market insights.
Kemira Oyj
-
Market share: 14% in North America
-
Specializes in biological ammonia removers for agriculture and industrial applications; annual production around 25 kilotons. The company emphasizes eco-friendly technologies and R&D investments, reinforcing North American ammonia remover market growth.
Investment Analysis
Investment in the North American ammonia remover market is projected at USD 420 million in 2026, with 60% allocated to the water treatment sector, 25% to agriculture, and 15% to industrial applications. Regional allocation shows 72% investment in the United States and 28% in Canada. M&A agreements and collaborations between technology providers and municipal utilities are enhancing production capabilities, with consolidation increasing market efficiency. Collaborative R&D efforts focus on high-efficiency biological removers, with over 20% of total investment dedicated to sustainable product innovation. These factors emphasize North America's ammonia remover market growth and insights.
New Product Developments
New product development is focused on enzyme-based and high-efficiency adsorption systems, comprising 22% of total product launches in 2026. Performance improvements of 10–12% in ammonia reduction efficiency have been reported, with innovation targeting lower operational costs and improved environmental compliance. Technical advancements include faster reaction times and improved adsorption capacity, reinforcing North America's ammonia remover market demand.
Recent Developments in North American Ammonia Remover Market
- 2026: Ecolab launched an advanced chemical ammonia remover, increasing municipal water treatment efficiency by 12%.
- 2025: Kemira Oyj expanded biological remover production by 20%, supporting agricultural runoff management.
Research Methodology
The North America Ammonia Remover Market research is based on a combination of primary and secondary research. Primary research included interviews with over 50 industry experts, water utility managers, and agricultural producers to collect firsthand insights on production, consumption, and adoption trends. Secondary research involved analyzing industry reports, trade publications, regulatory filings, and company financial statements to corroborate market estimates. Market size estimation employed both top-down and bottom-up approaches, incorporating production volume, historical growth rates, and sector-wise consumption data. Quantitative modeling and triangulation techniques ensured accuracy in market forecasts from 2026 to 2034. Data on market share, demand trends, and technological adoption was cross-validated through multiple sources, providing a comprehensive, data-driven analysis for stakeholders in the North American Ammonia Remover Market insights.
Frequently Asked Questions
Senior Market Research Analyst | 9 Years Experience | Specialty Chemicals and Industrial Coatings
Myra Irons is a market research analyst with 7–9 years of experience specializing in chemicals and materials markets. Contributed to 70+ research reports for global clients. Expertise includes market sizing, forecasting, competitive analysis, and trend evaluation across key regions.