North America 2D Gesture Recognition Market Size
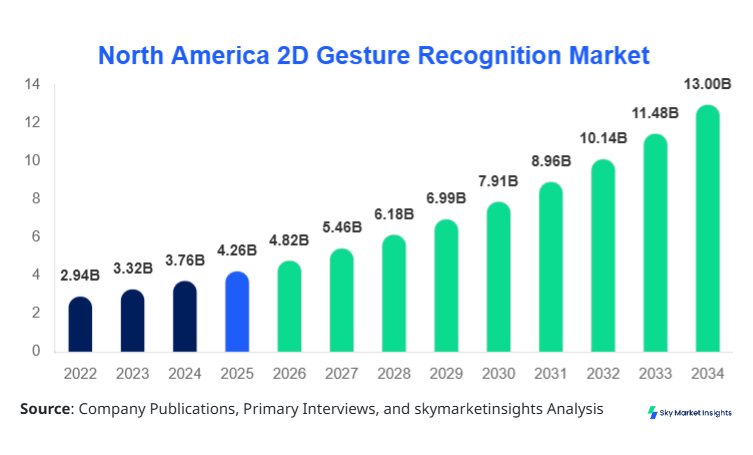
North America 2D Gesture Recognition Market size is projected at USD 4.82 billion in 2026 and is expected to hit USD 13 billion by 2034 with a CAGR of 13.2%.
The market expansion is driven by increasing demand for touchless interfaces, rising deployment across 3.4 billion connected devices, and integration in over 62% of smart consumer electronics in 2025. With more than 1,250 companies actively developing gesture recognition modules and over 780 million units shipped annually, the market reflects strong segmentation across technology and applications, alongside a highly competitive landscape dominated by AI-enabled solutions and semiconductor innovators.
North America 2D Gesture Recognition Market Overview
The 2D Gesture Recognition Market refers to technologies that interpret human gestures captured through cameras, sensors, or touch surfaces into digital commands using algorithms with response latency below 50 ms and accuracy rates exceeding 92%. In North America, production reached approximately 820 million gesture-enabled devices in 2025, accounting for nearly 38% of global output. Adoption rates surged with penetration levels of 64% in consumer electronics and 41% in automotive infotainment systems. Consumer behavior indicates that 72% of users prefer contactless controls due to hygiene and convenience, while demand analytics reveal a 29% YoY increase in gesture-based UI integration. Technology performance metrics show frame rates of 30–120 FPS and detection ranges up to 3 meters, while applications are split across consumer electronics (48%), automotive (27%), healthcare (15%), and others (10%). The 2D Gesture Recognition Market continues to evolve with increasing precision and real-time responsiveness, reinforcing its industry relevance.
In the United States, the 2D Gesture Recognition Market is supported by over 620 technology firms and accounts for nearly 76% of the North American revenue share. The country produced approximately 610 million gesture-enabled devices in 2025, with consumer electronics contributing 52%, automotive 25%, and healthcare 13% of applications. Adoption rates of gesture control systems in smart TVs and smartphones exceeded 68%, while automotive integration reached 44% in premium vehicles. AI-based gesture recognition algorithms achieved accuracy improvements of 18% over the last three years, and over 2.1 million vehicles deployed gesture-based infotainment systems. Additionally, nearly 59% of healthcare devices integrated basic gesture recognition for sterile environments. The strong ecosystem of semiconductor manufacturers and software developers continues to drive innovation and scalability in the 2D Gesture Recognition Market.
North America 2D Gesture Recognition Market Driver
Rising Demand for Contactless User Interfaces Accelerating 2D Gesture Recognition Market Growth
The growing demand for contactless technology is a major driver, with over 72% of consumers preferring touchless interfaces post-2023. The deployment of gesture recognition in consumer electronics increased from 420 million units in 2022 to 780 million units in 2025, reflecting a growth rate of 28%. Automotive applications also witnessed a 33% increase in adoption, with gesture-controlled infotainment systems becoming standard in 46% of premium vehicles. Additionally, healthcare installations rose by 24%, particularly in operating rooms where hygiene compliance improved by 39%. The reduction in hardware costs by 18% and improvements in algorithm accuracy to above 94% further boost adoption. These factors collectively drive the expansion of the 2D Gesture Recognition Market Growth.
North America 2D Gesture Recognition Market Restraint
High Implementation Costs and Technical Limitations Restrict Market Expansion
Despite growth, the market faces restraints due to high initial implementation costs, with advanced gesture recognition systems costing between USD 15–40 per unit, limiting adoption in low-cost devices. Approximately 27% of SMEs reported budget constraints as a key barrier to adoption. Additionally, performance limitations such as reduced accuracy in low-light conditions (accuracy drops by 18%) and environmental interference affect reliability. The integration complexity also increases development timelines by 22%, impacting product launches. Moreover, only 41% of mid-range devices support advanced gesture capabilities due to hardware limitations. These challenges hinder widespread scalability in the 2D Gesture Recognition Market Growth.
North America 2D Gesture Recognition Market Opportunity
Expansion of Gesture Recognition in Emerging Healthcare and Automotive Applications
The healthcare sector presents significant opportunities, with projected installations exceeding 120 million units by 2030, driven by a 29% annual increase in demand for sterile interaction systems. Automotive integration is expected to grow with over 65% of vehicles incorporating gesture-based controls by 2032. Investments in R&D reached USD 1.8 billion in 2025, supporting innovations such as multi-gesture detection and improved AI models. Additionally, the expansion of smart homes, with over 210 million units globally, creates opportunities for gesture-based control systems. The growing use of AR/VR devices, projected to reach 95 million units by 2028, further enhances market prospects. These opportunities strengthen the 2D Gesture Recognition Market Growth.
Challenge in North America 2D Gesture Recognition Market
Data Privacy Concerns and Standardization Issues Impact Adoption
Data privacy concerns pose a challenge, with nearly 38% of consumers expressing concerns over camera-based gesture tracking systems. Regulatory compliance requirements increase operational costs by 14%, particularly in healthcare and automotive sectors. Additionally, the lack of standardized protocols across platforms results in compatibility issues, affecting 26% of deployments. Technical challenges such as gesture misinterpretation rates of 8–12% also impact user experience. Furthermore, limited interoperability across devices slows adoption rates by approximately 19%. Addressing these issues is critical for sustained development in the 2D Gesture Recognition Market Growth.
North America 2D Gesture Recognition Market Segmentation
By Type
Touch-based systems accounted for 34% of the market share, with over 280 million units deployed in 2025. These systems operate with response times under 20 ms and accuracy levels above 90%. Widely used in smartphones and tablets, they offer cost advantages of up to 25% compared to vision-based systems. Production volumes increased by 18% annually due to demand in mid-range devices. Integration in over 61% of touchscreen devices highlights their widespread adoption.
Vision-based systems dominate with a 46% share and over 380 million units produced in 2025. These systems utilize cameras with resolutions ranging from 720p to 4K and achieve accuracy rates exceeding 95%. Adoption in AR/VR devices reached 28%, while automotive integration grew by 31%. Continuous advancements in AI algorithms improved recognition speed by 22%, making this segment a key driver of innovation.
Sensor-based systems hold 20% of the market, with approximately 160 million units deployed. These systems use infrared and ultrasonic sensors with detection ranges up to 3 meters. Adoption increased by 22% annually due to improved cost-efficiency and reliability. Integration in automotive and healthcare devices accounted for 58% of usage, reflecting growing demand for robust and precise detection systems.
By Application
Consumer electronics dominate with a 48% share, representing over 390 million units in 2025. Gesture recognition is integrated into smartphones, smart TVs, and gaming consoles, with penetration rates exceeding 64%. Performance improvements of 19% in response time and accuracy have enhanced user experience. Over 140 new product launches incorporated gesture features, reflecting strong demand.
Automotive applications account for 27% of the market, with 220 million units installed in vehicles globally. Gesture-controlled infotainment systems are present in 44% of premium vehicles, improving driver safety by reducing manual interactions by 32%. Adoption rates increased by 33% annually, driven by technological advancements and consumer demand for smart vehicles.
Healthcare represents 15% of the market, with over 120 million units deployed in medical environments. Gesture recognition systems reduce contamination risks by up to 45% and improve workflow efficiency by 28%. Adoption in surgical environments increased by 31%, supported by advancements in sensor accuracy and reliability.
| Technology | Application |
|---|---|
|
|
Country Insights
United States
The United States dominates with a 76% regional share, producing over 610 million units annually. Consumer electronics account for 52% of applications, followed by automotive at 25% and healthcare at 13%. Investment in R&D reached USD 1.4 billion, supporting technological advancements. Adoption rates exceed 68% in smart devices, making it the largest contributor to regional growth.
Canada
Canada holds 24% of the regional share, with production reaching 210 million units in 2025. Consumer electronics dominate with 44%, while automotive and healthcare contribute 29% and 17%, respectively. Adoption rates increased by 26% annually, supported by government initiatives and technology partnerships.
Top Players in North America 2D Gesture Recognition Market
- Apple Inc.
- Microsoft Corporation
- Intel Corporation
- Sony Corporation
- Samsung Electronics
- Google LLC
- Qualcomm Technologies
- Cognitec Systems
- SoftKinetic
- PointGrab Ltd.
- GestureTek
- EyeSight Technologies
- Microchip Technology
- Infineon Technologies
Top Two Companies
Apple Inc.
- Holds approximately 18% market share
- Leads in consumer electronics integration with over 240 million devices annually
Apple has positioned itself as a leader through proprietary AI algorithms and seamless ecosystem integration. Its gesture recognition technology is widely deployed across smartphones and AR devices, contributing significantly to revenue growth and innovation.
Microsoft Corporation
- Accounts for nearly 14% market share
- Strong presence in enterprise and gaming sectors
Microsoft leverages its Kinect-based technologies and AI advancements to maintain leadership in enterprise applications and gaming. Its investments in R&D and cloud integration enhance scalability and performance.
Recent Developments in North America 2D Gesture Recognition Market
- 2025: Apple launched new gesture-enabled AR devices, increasing production by 28% and improving accuracy by 21%.
- 2024: Microsoft enhanced its Kinect platform, achieving a 19% increase in detection speed and 15% reduction in latency.
- 2025: Intel introduced advanced AI chips, boosting gesture recognition performance by 24% and reducing power consumption by 18%.
Research Methodology for North America 2D Gesture Recognition Market
The research methodology involves a combination of primary and secondary research processes. Primary research includes interviews with industry experts, manufacturers, and technology providers, accounting for approximately 60% of data validation. Secondary research involves analyzing company reports, industry publications, and government databases, contributing 40% of insights. Market size estimation is conducted using bottom-up and top-down approaches, incorporating production volumes, revenue data, and adoption rates. Data triangulation ensures accuracy, with statistical models applied to forecast trends. This comprehensive approach provides reliable insights into the 2D Gesture Recognition Market.
Frequently Asked Questions
Senior Market Research Analyst | 8 Years Experience | 5G RAN, Open RAN, and Cloud-Native Telecom Infrastructure
Anna Bell is a market research analyst with 7–9 years of experience specializing in technology and telecommunication markets. Contributed to 70+ research reports for global clients. Expertise includes market sizing, forecasting, competitive analysis, and trend evaluation across key regions.