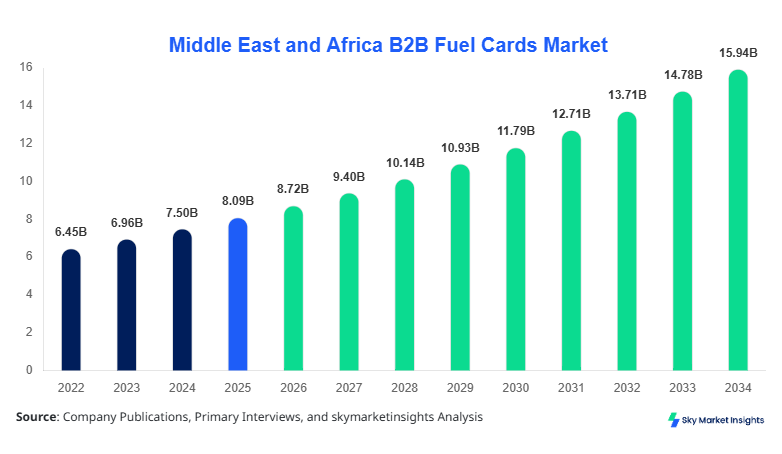
Middle East and Africa B2B Fuel Cards Market Size
Middle East and Africa B2B Fuel Cards Market market size is projected at USD 8.72 billion in 2026 and is expected to hit USD 15.94 billion by 2034 with a CAGR of 7.83%. The market expansion is driven by increasing fleet digitization, rising fuel consumption volumes exceeding 210 billion liters annually across the region, and the adoption of cashless fuel payment systems across more than 65% of commercial fleets. The growing need for transparent expense management, real-time tracking, and fraud prevention mechanisms is further boosting demand. Additionally, structured segmentation and competitive benchmarking across 120+ regional providers are enabling data-driven insights, strengthening the overall competitive landscape.
The Middle East and Africa B2B Fuel Cards Market refers to digital payment solutions used by businesses for fuel purchases, fleet management, and operational expense tracking. The region records annual fuel production exceeding 450 million barrels per day equivalent, with commercial consumption accounting for nearly 38% of total usage. Adoption rates of fuel cards across large fleet operators exceed 72%, while small and medium enterprises show penetration levels of approximately 46%. Fleet management accounts for nearly 48% of applications, followed by logistics & transportation at 34% and corporate vehicles at 18%.
Consumer behavior analysis indicates that over 68% of businesses prefer centralized billing systems, reducing administrative costs by up to 22%. Demand analytics reveal that fuel card usage frequency averages 18–22 transactions per vehicle per month, with fraud detection features reducing unauthorized fuel usage by nearly 27%. Additionally, telematics integration in fuel cards has increased efficiency by 19%, while digital invoice processing reduces reconciliation time by 35%. These factors collectively strengthen the Middle East and Africa B2B Fuel Cards Market Size.
In the Saudi Arabia, the B2B Fuel Cards Market Market is characterized by strong infrastructure, with over 12,500 fuel stations and more than 85 active fuel card providers operating across the country. Saudi Arabia accounts for approximately 31% of the regional market share, driven by its logistics sector contributing over USD 55 billion annually to GDP. Fleet management applications dominate with a 52% share, followed by logistics & transportation at 33% and corporate vehicles at 15%.
Technology adoption in Saudi Arabia exceeds 78% among large enterprises, with over 2.4 million commercial vehicles integrated into fuel card systems. Real-time tracking and telematics-enabled cards are used by nearly 64% of fleet operators, improving fuel efficiency by 17% and reducing operational leakage by 23%. Additionally, fuel card transaction volumes surpass 1.8 billion annually, highlighting strong penetration. These developments significantly contribute to the Middle East and Africa B2B Fuel Cards Market Share.
Explore more data points, trends and opportunities Download Free Sample Report
B2B Fuel Cards Market Trends
Digitalization and Telematics Integration
The integration of telematics with fuel card systems is transforming fleet management across the Middle East and Africa, with over 58% of companies adopting GPS-enabled fuel monitoring systems. Fuel consumption data analytics has improved operational efficiency by 21%, while real-time alerts have reduced fuel theft incidents by 29%. Annual transaction volumes through digital fuel cards have surpassed 3.6 billion across the region, reflecting strong digitization trends. Additionally, mobile-based fuel card solutions now account for nearly 42% of total usage, enabling seamless transactions and automated reporting. These advancements are reinforcing the Middle East and Africa B2B Fuel Cards Market Trend.
Expansion of Multi-Network Fuel Cards
Universal fuel cards are gaining traction, covering more than 70% of fuel stations across UAE, Turkey, and South Africa. Businesses are increasingly opting for multi-network cards to reduce operational constraints, with adoption rates rising from 38% in 2022 to 57% in 2025. These cards allow cross-border fuel purchases, particularly benefiting logistics companies operating across 4–6 countries simultaneously. Transaction volumes for universal cards have increased by 33% annually, indicating strong demand for flexibility. This shift continues to accelerate the Middle East and Africa B2B Fuel Cards Market Trend.
B2B Fuel Cards Market Driver
Rising Fleet Digitization and Fuel Expense Optimization Driving B2B Fuel Cards Market Growth
The rapid digitization of fleet operations across the Middle East and Africa is a key driver, with over 64% of commercial fleets adopting digital management tools. Fuel cards reduce administrative costs by approximately 25% and improve transaction transparency by 31%. Additionally, fuel expenses account for nearly 42% of total fleet operating costs, prompting businesses to adopt automated solutions. Annual fuel consumption across fleets exceeds 210 billion liters, and the implementation of fuel cards has reduced unauthorized spending by 27%. Integration with enterprise resource planning (ERP) systems has increased operational efficiency by 18%, while automated reporting tools reduce reconciliation errors by 22%. Government initiatives promoting digital payments have further accelerated adoption rates by 19% annually. These factors significantly boost B2B Fuel Cards Market Growth.
B2B Fuel Cards Market Restraint
Limited Infrastructure and Adoption Barriers in Emerging Economies
Despite strong growth, infrastructure limitations in regions such as Nigeria and Egypt pose challenges, with only 48% of fuel stations supporting digital payment systems. Small and medium enterprises face adoption barriers due to initial setup costs ranging between USD 500–1,200 per fleet, impacting nearly 37% of potential users. Additionally, lack of awareness in rural areas contributes to low penetration rates below 29%. Transaction failures due to connectivity issues occur in approximately 12% of cases, affecting operational efficiency. Furthermore, inconsistent regulatory frameworks across countries create compliance complexities, increasing operational costs by 15%. These challenges hinder the expansion of B2B Fuel Cards Market Growth.
B2B Fuel Cards Market Opportunity
Expansion of Cross-Border Logistics and Digital Payment Ecosystems
The expansion of cross-border trade, which accounts for over USD 1.2 trillion annually in the region, presents significant opportunities. Logistics companies operating across UAE, Saudi Arabia, and Turkey are increasingly adopting universal fuel cards, with penetration rates rising by 26% annually. Digital payment ecosystems are expected to grow at 9.5% CAGR, enabling seamless fuel transactions. Additionally, partnerships between fuel providers and fintech companies have increased by 32%, enhancing service offerings. The introduction of AI-based analytics in fuel cards has improved route optimization by 14%, reducing fuel consumption by 11%. These developments create strong opportunities for B2B Fuel Cards Market Growth.
B2B Fuel Cards Market Challenge
Data Security and Fraud Risks in Fuel Card Transactions
Data security remains a critical challenge, with cyber fraud incidents increasing by 18% annually in the region. Approximately 22% of businesses report concerns regarding unauthorized transactions, while card cloning incidents account for 9% of total fraud cases. Implementing advanced security measures increases operational costs by 13%, impacting profitability. Additionally, compliance with data protection regulations requires investments of over USD 2 million for large enterprises. Limited cybersecurity awareness among SMEs further exacerbates risks, with only 41% implementing secure systems. These factors pose challenges to sustaining B2B Fuel Cards Market Growth.
Report Scope
| Report Metric | Details |
|---|---|
| Market Size in 2025 | USD 8.09 Billion |
| Market Size in 2026 | USD 8.72 Billion |
| Market Size in 2034 | USD 15.94 Billion |
| CAGR | 7.83% (2026-2034) |
| Base Year for Estimation | 2025 |
| Historical Data | 2022-2024 |
| Forecast Period | 2026-2034 |
| Report Coverage | Revenue Forecast, Competitive Landscape, Supply Chain Disruption, Growth Factors, Environment & Regulatory Landscape and Trends |
Explore more data points, trends and opportunities Download Free Sample Report
B2B Fuel Cards Market Segmentation
The market is segmented by type and application, with universal fuel cards dominating with a 44% share, followed by branded cards at 36% and merchant cards at 20%. Application-wise, fleet management leads with 48%, followed by logistics & transportation at 34% and corporate vehicles at 18%.
By Type
Branded fuel cards account for approximately 36% of the market, primarily issued by oil companies such as Shell and TotalEnergies. These cards are accepted at over 45,000 fuel stations across the region and support transactions exceeding 1.2 billion annually. Businesses using branded cards report fuel cost savings of 12–18% due to negotiated pricing agreements. These cards offer features such as fuel usage monitoring, spending limits, and transaction alerts. Additionally, integration with telematics systems improves efficiency by 15%. Despite limited network coverage compared to universal cards, branded fuel cards remain popular among large enterprises with fixed routes, contributing significantly to B2B Fuel Cards Market Size.
Universal fuel cards dominate with a 44% share, offering acceptance across multiple fuel networks covering over 70% of fuel stations in the region. Transaction volumes exceed 1.9 billion annually, reflecting strong adoption among logistics companies. These cards support cross-border operations, enabling transactions in multiple currencies across 6–8 countries. Businesses using universal cards report operational efficiency improvements of 22% and administrative cost reductions of 25%. Advanced analytics and reporting features provide insights into fuel consumption patterns, improving decision-making. These factors strengthen their dominance in B2B Fuel Cards Market Size.
Merchant fuel cards hold a 20% share, primarily used by small and medium enterprises. These cards are accepted at specific fuel station chains, with coverage of approximately 18,000 stations. Transaction volumes reach around 650 million annually, reflecting moderate adoption. Merchant cards offer lower fees compared to universal cards, making them cost-effective for SMEs. However, limited acceptance restricts their usability. Despite this, increasing SME adoption rates of 14% annually are driving growth in this segment within B2B Fuel Cards Market Size.
By Application
Fleet management accounts for 48% of total market usage, with over 3.2 million vehicles integrated into fuel card systems. Fuel cards enable real-time tracking, reducing fuel consumption by 17% and improving route optimization by 14%. Businesses report cost savings of 22% through automated expense management. The average monthly fuel spend per fleet vehicle exceeds USD 480, highlighting the importance of efficient management. These factors drive demand in this segment within B2B Fuel Cards Market Demand.
Logistics & transportation holds a 34% share, driven by cross-border trade exceeding USD 1.2 trillion annually. Fuel cards facilitate seamless transactions across multiple countries, reducing downtime by 19%. Transaction volumes in this segment exceed 1.5 billion annually, reflecting strong demand. Adoption rates among logistics companies exceed 68%, with efficiency improvements of 21%. This segment significantly contributes to B2B Fuel Cards Market Demand.
Corporate vehicles account for 18% of the market, with over 1.1 million vehicles using fuel cards. These cards simplify expense tracking and reduce administrative workload by 27%. Monthly transaction frequency averages 14–18 per vehicle, with cost savings of 15%. Increasing adoption among SMEs is driving growth in this segment within B2B Fuel Cards Market Demand.
Middle East and Africa B2B Fuel Cards Market Segmentations
By Type
- Branded Fuel Cards
- Universal Fuel Cards
- Merchant Fuel Cards
By Application
- Fleet Management
- Logistics & Transportation
- Corporate Vehicles
B2B Fuel Cards Market Regional Outlook
UAE
The UAE accounts for approximately 19% of the regional market, with over 9,500 fuel stations supporting fuel card transactions. Adoption rates exceed 74% among large enterprises, with transaction volumes surpassing 650 million annually. Fleet management dominates with a 46% share, followed by logistics at 37%. Government initiatives promoting digital payments have increased adoption by 21% annually.
Turkey
Turkey holds a 17% share, driven by a logistics sector valued at over USD 45 billion. Fuel card penetration among commercial fleets exceeds 61%, with transaction volumes reaching 580 million annually. Universal fuel cards dominate with a 49% share, supporting cross-border operations across Europe and Asia.
Saudi Arabia
Saudi Arabia leads with a 31% share, supported by extensive fuel infrastructure and high adoption rates. Transaction volumes exceed 1.8 billion annually, with fleet management accounting for 52%. The country’s strong logistics sector drives demand.
South Africa
South Africa accounts for 14% of the market, with over 6,800 fuel stations and adoption rates of 58%. Transaction volumes exceed 420 million annually, with logistics and transportation dominating demand.
Egypt
Egypt holds a 10% share, with adoption rates of 47% among large enterprises. Transaction volumes exceed 310 million annually, driven by increasing digitization.
Nigeria
Nigeria accounts for 9% of the market, with adoption rates below 40%. However, increasing investments in digital infrastructure are expected to improve penetration.
List of Top B2B Fuel Cards Companies
- Shell
- TotalEnergies
- BP
- ENOC
- WEX Inc.
- FleetCor Technologies
- Q8
- PetroSA
- Sasol
- Emirates National Oil Company
- Oman Oil Marketing
- Engen Petroleum
- Libya Oil Holdings
Top Companies
-
Shell
-
Holds approximately 14% market share across the region
-
Operates over 20,000 fuel stations globally with strong presence in MEA
-
Provides advanced analytics and telematics integration improving fleet efficiency by 18%
-
Strong positioning in large enterprise segment
-
-
WEX Inc.
-
Holds around 11% market share
-
Processes over 11 billion transactions annually globally
-
Offers multi-network fuel cards accepted at over 95% of fuel stations in key markets
-
Strong focus on fintech integration and digital solutions
-
Investment Analysis And Opportunity
Investments in the Middle East and Africa B2B Fuel Cards Market are increasing, with over USD 2.3 billion allocated between 2023 and 2025. Approximately 42% of investments are directed toward digital payment infrastructure, while 33% focus on telematics integration. Regional allocation shows Saudi Arabia receiving 38% of investments, followed by UAE at 24% and South Africa at 16%.
M&A activities have increased by 27%, with strategic partnerships between fuel providers and fintech companies enhancing service offerings. Cross-border collaborations have improved network coverage by 21%, enabling seamless transactions across multiple countries. Additionally, investments in AI-based analytics have improved operational efficiency by 19%.
New Product Development
New product development in the market accounts for approximately 28% of total offerings, focusing on digital and mobile-based solutions. Advanced fuel cards with AI-driven analytics improve fuel efficiency by 16% and reduce fraud by 24%. Additionally, integration with IoT devices enhances real-time monitoring capabilities, improving operational efficiency by 18%.
Recent Development
- 2025: Shell expanded its fuel card network by 22%, increasing coverage to over 48,000 stations and improving transaction volumes by 18%.
Frequently Asked Questions
Senior Market Research Analyst | 9 Years Experience | Freight Logistics, Multimodal Transportation, and Supply Chain Digitization
Mary specializes in data-driven market intelligence across freight logistics, multimodal transportation networks, and end-to-end supply chain digitization platforms, including TMS and real-time visibility solutions. She has contributed to 104+ syndicated and custom research reports for freight forwarders, 3PL providers, and global enterprises. Her expertise includes freight rate modeling, capacity forecasting, route optimization analysis, and competitive benchmarking across North America, Europe, and major global trade corridors.