Asia Pacific Phentermine Hydrochloride Market Size
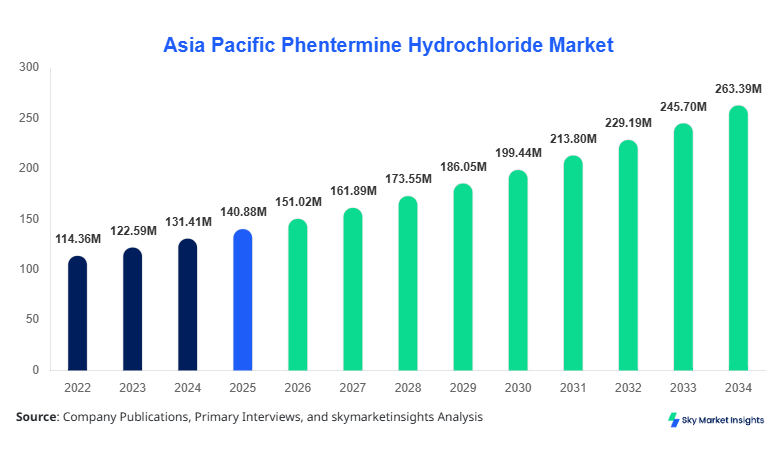
Asia Pacific Phentermine Hydrochloride Market size is projected at USD 151.02 million in 2026 and is expected to hit USD 264.55 million by 2034 with a CAGR of 7.2%. The 2025 base-year value stood at USD 140.79 million, indicating sustained expansion across major Asian pharmaceutical markets. Assessment of dosage forms, strengths, administration routes, applications, distribution channels, end users, and branded versus generic products provides the data framework needed to evaluate commercial positioning and the competitive landscape.
Key Takeaways
- China dominates geographically with approximately 37.9% of 2026 revenue and USD 57.26 million, while Southeast Asia is the fastest-growing geography at 7.92% CAGR through 2034.
- Tablets dominate dosage forms with approximately 49.4% of 2026 revenue, representing USD 74.75 million; extended-release formulations are the fastest-growing listed dosage form at 7.50% CAGR.
- India is a major emerging country market, increasing from USD 31.99 million in 2026 to USD 56.42 million by 2034, at 7.35% CAGR.
- China is forecast to reach USD 98.38 million by 2034, while Japan advances to USD 36.78 million at 7.33% CAGR.
- South Korea records a comparatively strong 7.53% CAGR, expanding from USD 7.57 million in 2026 to USD 13.53 million in 2034.
The phentermine hydrochloride market comprises prescription pharmaceutical formulations containing phentermine hydrochloride for short-term pharmacological management of obesity and overweight patients meeting relevant clinical criteria. Asia Pacific generated USD 140.79 million in 2025, increasing to USD 151.02 million in 2026. China contributes about 37.9% of the 2026 country total, India 21.2%, Japan 13.8%, and Southeast Asia 10.1%. By formulation, tablets account for approximately 49.4% of the independently reported 2026 dosage-form total of USD 151.19 million, followed by capsules at 25.4%, ODT at 15.1%, and extended-release formulations at approximately 10.0%, illustrating concentrated adoption of conventional oral solid dosage formats.
Explore more data points, trends and opportunities Download Free Sample Report
Asia Pacific Phentermine Hydrochloride Market Trends
Digital Obesity Care and Convenient Oral Formulations Reshape Prescribing
Digital obesity management is increasingly connecting prescription therapies with teleconsultation, electronic prescribing, BMI tracking, and remote follow-up. Across large Asia Pacific healthcare systems serving populations exceeding 4 billion, even a 1–2% shift in eligible patients toward digitally coordinated weight-management programs can represent tens of millions of potential interactions. Pharmaceutical manufacturers are consequently emphasizing scalable tablet manufacturing, unit-dose packaging, electronic supply-chain visibility, and higher-throughput production lines capable of handling millions of tablets annually.
Formulation innovation is also moving toward patient convenience, including orally disintegrating and modified-release approaches. A 5–10 percentage-point improvement in refill persistence can materially affect prescription volumes in chronic weight-management ecosystems, while telehealth models can reduce several physical clinic interactions during a treatment cycle. Demand is particularly concentrated around physician-supervised obesity treatment, metabolic-risk management, and specialist weight-loss services, with digital channels increasingly complementing hospital and retail pharmacy infrastructure.
Asia Pacific Phentermine Hydrochloride Market Drivers
Expanding Obesity Burden and Structured Weight-Management Programs
Increasing obesity prevalence, urbanization, sedentary lifestyles, and metabolic comorbidities are widening the clinically addressable population. Across countries containing more than 60% of the world's population, a movement of only 0.5–1.0% of eligible adults into medically supervised pharmacotherapy can translate into millions of additional patient encounters. Where treatment adherence improves by 10–15%, annual prescription volumes can increase further, supporting manufacturing requirements measured in tens or hundreds of millions of dosage units across large pharmaceutical supply networks.
Asia Pacific Phentermine Hydrochloride Market Restraints
Controlled Prescribing and Safety Monitoring Limit Broad Utilization
Phentermine's sympathomimetic profile requires careful patient selection, prescription control, and monitoring, constraining unrestricted adoption. Treatment commonly involves relatively short therapeutic periods rather than uninterrupted multi-year exposure, reducing lifetime prescription volume per patient. Even a 10–20% reduction in eligible prescribing caused by cardiovascular risk screening, contraindications, or regulatory controls can remove substantial volumes from addressable demand, while monitoring requirements may add 2–4 clinical touchpoints to a supervised treatment pathway.
Asia Pacific Phentermine Hydrochloride Market Opportunities
Telehealth Expansion Creates New Access Pathways
Telehealth, electronic prescriptions, online pharmacy fulfillment, and digital weight-management programs can improve access for populations located outside major metropolitan centers. If digitally enabled programs capture merely 2–5% of clinically eligible patients across high-population countries, prescription demand could expand by millions of treatment courses. Online consultation models may eliminate 1–3 physical visits per treatment episode, while integrated BMI, blood-pressure, and adherence monitoring can improve follow-up rates by 10–20% in appropriately supervised programs.
Challenges in Asia Pacific Phentermine Hydrochloride Market
Competition from Newer Anti-Obesity Therapies Intensifies
The principal commercial challenge is the rapid evolution of obesity pharmacotherapy, including newer long-duration treatment classes. Where competing therapies capture an additional 5–10% of pharmacologically treated patients, established sympathomimetic products face measurable prescription displacement. Manufacturers must simultaneously manage active pharmaceutical ingredient consistency, batch volumes reaching millions of units, pharmacovigilance obligations, and distribution across more than 8 major Asia Pacific country clusters while maintaining affordability and regulatory compliance.
Report Scope
| Report Metric | Details |
|---|---|
| Market Size in 2025 | USD 140.88 Million |
| Market Size in 2026 | USD 151.02 Million |
| Market Size in 2034 | USD 264.55 Million |
| CAGR | 7.2% (2026-2034) |
| Base Year for Estimation | 2025 |
| Historical Data | 2022-2024 |
| Forecast Period | 2026-2034 |
| Report Coverage | Revenue Forecast, Competitive Landscape, Supply Chain Disruption, Growth Factors, Environment & Regulatory Landscape and Trends |
Explore more data points, trends and opportunities Download Free Sample Report
Asia Pacific Phentermine Hydrochloride Market Segmentation
The market is segmented by dosage form, strength, route of administration, distribution channel, application, end user, and sales type. Among dosage forms, tablets represent approximately 49.4% of the 2026 dosage-form total, capsules 25.4%, ODT 15.1%, and extended-release formulations approximately 10.0%.
By Dosage Form
Tablets are the largest dosage-form category, rising from USD 69.47 million in 2025 to USD 74.75 million in 2026 and USD 134.31 million by 2034, representing 7.60% CAGR. Their scale reflects established manufacturing, prescribing familiarity, dosing convenience, and broad pharmacy distribution.
Extended-release formulations are the fastest-growing secondary formulation category identified in the supplied dataset, recording 7.50% CAGR and increasing from USD 15.17 million in 2026 to USD 27.05 million by 2034. Capsules grow at 7.16%, while ODT advances at 7.02%.
By Strength
The strength segmentation comprises 8 mg, 15 mg, 18.75 mg, 30 mg, and 37.5 mg presentations. Commercial utilization varies according to prescribing protocols, titration requirements, local registrations, patient tolerability, and physician preference, with five principal strength categories supporting differentiated dosing.
No strength-level revenue or CAGR figures were supplied; therefore, no unsupported largest or fastest-growing strength is assigned. The five-strength portfolio nevertheless provides manufacturers with multiple dosing configurations while preserving the mandatory numerical dataset without extrapolation.
By Route of Administration
Oral and sublingual administration form the 2 route categories. Oral products benefit from established tablet and capsule infrastructure, while sublingual delivery represents an alternative patient-oriented pathway where approved and commercially available.
No route-specific revenue or CAGR dataset was provided. Accordingly, quantitative dominance or fastest-growth claims across these 2 routes are not inferred.
By Distribution Channel
Distribution spans 4 channels: hospital pharmacies, retail pharmacies, online pharmacies, and weight-loss clinics. The structure reflects conventional prescription fulfillment alongside digitally enabled and specialist obesity-care pathways.
No channel-level market values or CAGRs were supplied, preventing numerical ranking of the 4 channels without introducing unsupported estimates.
By Application
Applications comprise 2 clinical groups: obesity at BMI ≥30 and overweight at BMI ≥27 with qualifying comorbidities such as hypertension or diabetes. These thresholds establish differentiated clinical populations for supervised pharmacotherapy.
No application-specific revenue or CAGR figures were supplied; consequently, neither of the 2 application categories is quantitatively designated as the largest or fastest-growing.
By End User
The 4 end-user categories are hospitals, ambulatory surgical centers, specialty weight-loss clinics, and homecare/telehealth users. Their participation reflects the transition from institution-centered prescribing toward hybrid and remote weight-management delivery.
No end-user revenue or CAGR figures were provided for these 4 categories, so quantitative leadership is not estimated.
By Sales Type
Sales comprise 2 categories: branded drugs and generic drugs. Generic competition supports price accessibility and broad dispensing, while branded products compete through formulation, availability, and commercial positioning.
No sales-type revenue or CAGR values were supplied. Therefore, numerical dominance and fastest-growth designations between the 2 categories are intentionally withheld.
Asia Pacific Phentermine Hydrochloride Market Segmentations
By Dosage Form
- Tablets
- Capsules
- Orally Disintegrating Tablets (ODT)
- Extended-Release Formulations
By Strength
- 8 mg
- 15 mg
- 18.75 mg
- 30 mg
- 37.5 mg
By Route of Administration
- Oral
- Sublingual
By Distribution Channel
- Hospital Pharmacies
- Retail Pharmacies
- Online Pharmacies
- Weight Loss Clinics
By Application
- Obesity (BMI ≥30)
- Overweight with Comorbidities (BMI ≥27 with conditions like hypertension, diabetes)
By End User
- Hospitals
- Ambulatory Surgical Centers
- Specialty Weight Loss Clinics
- Homecare/Telehealth Users
By Sales Type
- Branded Drugs
- Generic Drugs
Asia Pacific Phentermine Hydrochloride Market Country Outlook
China
China leads the region with approximately 37.9% of the 2026 country total. Revenue rises from USD 57.26 million in 2026 to USD 98.38 million by 2034 at 7.00% CAGR, making China the largest individual contributor to regional pharmaceutical production and consumption requirements.
South Korea
South Korea contributes approximately 5.0% in 2026, with revenue increasing from USD 7.57 million to USD 13.53 million by 2034. Its 7.53% CAGR is supported by developed pharmaceutical manufacturing and specialist healthcare channels.
Japan
Japan represents approximately 13.8% of 2026 regional revenue. The country advances from USD 20.89 million to USD 36.78 million by 2034, registering 7.33% CAGR, with hospital, pharmacy, and specialist channels shaping sector distribution.
India
India contributes approximately 21.2% in 2026 and is the second-largest listed country market. Revenue expands from USD 31.99 million to USD 56.42 million by 2034 at 7.35% CAGR, supported by extensive generic-drug manufacturing capacity and expanding organized healthcare access.
Australia
Australia accounts for approximately 5.0% of 2026 revenue, increasing from USD 7.54 million to USD 13.02 million by 2034 at 7.07% CAGR. Prescription pharmacy and specialist weight-management channels constitute important commercial pathways.
Singapore
Singapore contributes approximately 2.0% in 2026. Revenue increases from USD 3.02 million to USD 5.22 million by 2034, representing 7.09% CAGR, with its advanced healthcare and pharmaceutical distribution infrastructure supporting the sector.
Taiwan
Taiwan represents approximately 5.0% of 2026 revenue, expanding from USD 7.55 million to USD 13.24 million by 2034 at 7.27% CAGR. Hospital, retail pharmacy, and specialist prescribing networks contribute to commercial distribution.
Southeast Asia
Southeast Asia contributes approximately 10.1% of the 2026 total and records the fastest geographic CAGR at 7.92%. Revenue increases from USD 15.20 million in 2026 to USD 27.96 million by 2034, reflecting expanding healthcare access across multiple national pharmaceutical systems.
Top players in Asia Pacific Phentermine Hydrochloride Market
- KVK-Tech, Inc.
- Lannett Company, Inc.
- Teva Pharmaceutical Industries Ltd.
- Sandoz
- Sun Pharmaceutical Industries Ltd.
- Aurobindo Pharma Limited
- Dr. Reddy's Laboratories Ltd.
- Amneal Pharmaceuticals, Inc.
- Alvogen
- Hikma Pharmaceuticals PLC
- Lupin Limited
- Torrent Pharmaceuticals Ltd.
Top Two Companies
-
Teva Pharmaceutical Industries Ltd.
Teva operates at global pharmaceutical scale, with generic-drug manufacturing and distribution capabilities spanning numerous therapeutic areas and markets. Its positioning in a competitive prescription-drug environment is supported by high-volume production, established quality systems, and extensive distribution infrastructure. A precise Asia Pacific phentermine hydrochloride revenue share was not supplied and therefore is not fabricated; the company's percentage share is not disclosed in the provided dataset. Competitive positioning depends on regulatory approvals, product availability, pricing, manufacturing reliability, and relationships with pharmacy and healthcare channels.
-
Sun Pharmaceutical Industries Ltd.
Sun Pharma has a substantial Asia-focused pharmaceutical manufacturing base and broad capabilities in branded and generic medicines. Its regional position benefits from manufacturing scale, established distribution networks, and participation across multiple prescription categories. The supplied numerical dataset does not disclose a company-specific percentage share, so no unsupported share estimate is assigned. Competitive positioning is influenced by API sourcing, formulation capabilities, regulatory compliance, geographic reach, and the ability to serve high-volume pharmacy and institutional channels while responding to evolving obesity-treatment practices.
Recent Developments in Asia Pacific Phentermine Hydrochloride Market
- 2026: Digital prescribing and telehealth integration continue to expand obesity-treatment access, increasing emphasis on remote patient assessment and prescription fulfillment.
- 2025: Pharmaceutical suppliers intensified focus on scalable generic manufacturing and supply-chain resilience as obesity pharmacotherapy became increasingly competitive.
- 2025: Online pharmacy models strengthened prescription fulfillment capabilities, complementing traditional hospital and retail pharmacy networks.
Research Methodology
The study applies a structured top-down and bottom-up market assessment covering the 2022–2024 historical period, 2025 base year, 2026 current year, and 2026–2034 forecast period. Quantitative modeling prioritizes the mandatory country and dosage-form datasets supplied for this report, while segmentation is evaluated across 7 dimensions and regional analysis covers 8 geographic categories. Cross-checking focuses on internal consistency between base-year values, current-year estimates, forecast values, and stated CAGRs; where segment-specific or company-share data were not supplied, numerical values were not fabricated. Forecast interpretation considers pharmaceutical manufacturing, prescribing environments, obesity-care infrastructure, distribution evolution, formulation adoption, regulatory conditions, and competitive intensity.
Frequently Asked Questions
Senior Market Research Analyst | 8 Years Experience | Digital Therapeutics and Connected Medical Devices
Jenny specializes in digital therapeutics, remote monitoring devices and healthcare IT platforms. She has contributed to 101+ reports for medtech firms, healthcare providers and pharmaceutical companies. Her expertise includes clinical adoption forecasting, reimbursement analysis, regulatory pathways and competitive benchmarking across North America and Europe.