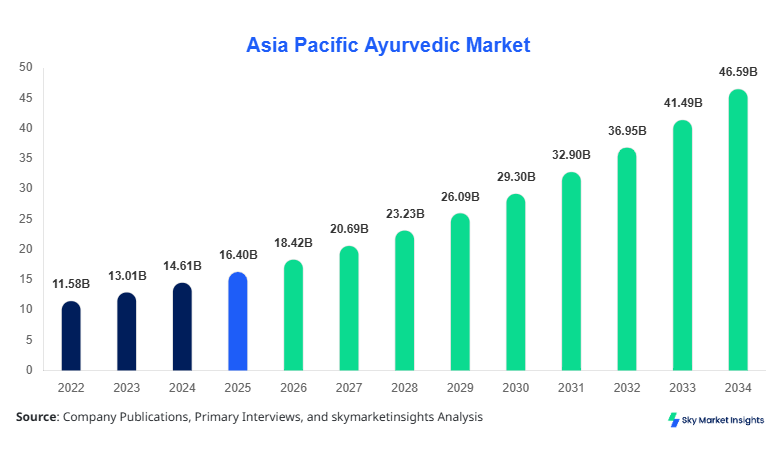
Asia Pacific Ayurvedic Market Size
Asia Pacific Ayurvedic Market market size is projected at USD 18.42 billion in 2026 and is expected to hit USD 46.78 billion by 2034 with a CAGR of 12.3%. The Asia Pacific Ayurvedic Market is witnessing accelerated expansion driven by increasing herbal product penetration across China, India, and Japan, with over 320 million consumers adopting Ayurvedic formulations in 2025. The need for structured data analytics, competitive benchmarking, and granular segmentation is critical as more than 68% of manufacturers diversify portfolios into supplements and personal care. Additionally, over 1.8 billion units of Ayurvedic products were distributed across Asia Pacific in 2025, highlighting the importance of comprehensive supply chain and pricing analysis within the Asia Pacific Ayurvedic Market.
The Asia Pacific Ayurvedic Market represents a traditional medicine ecosystem focused on plant-based formulations, herbal extracts, and natural wellness products rooted in Ayurvedic science. In 2025, Asia Pacific production exceeded 2.1 billion units, with India contributing 42%, China 18%, and Japan 9% of total output. Adoption rates have surged, with approximately 57% of urban consumers in Asia Pacific using Ayurvedic or herbal-based products at least once per month, while penetration in rural regions stands at 31%. Consumer behavior indicates that 64% of buyers prioritize chemical-free formulations, and 48% are willing to pay a 20–30% premium for certified organic Ayurvedic products.
From a demand analytics perspective, healthcare applications account for 46% of consumption, followed by personal care at 34% and wellness & lifestyle at 20%. Technical metrics such as herbal concentration levels (standardized at 60–85%), extraction efficiency (above 75%), and shelf life (18–36 months) are critical factors influencing purchasing decisions. Furthermore, over 72% of new product launches incorporate multi-herb formulations, enhancing efficacy and consumer trust, reinforcing the Asia Pacific Ayurvedic Market.
In the Japan, the Ayurvedic Market Market has gained significant traction, with over 1,250 registered herbal product companies and more than 3,800 retail outlets specializing in natural health solutions. Japan accounts for approximately 14% of the Asia Pacific Ayurvedic Market share, driven by high consumer awareness and premium product positioning. Healthcare applications dominate with a 52% share, followed by personal care at 28% and wellness products at 20%.
Technology adoption is robust, with over 68% of Japanese manufacturers using advanced extraction technologies such as CO2 extraction and nano-emulsion systems to enhance bioavailability by 25–40%. Additionally, digital distribution channels contribute to 36% of total sales, reflecting strong e-commerce penetration. With annual consumption exceeding 180 million units and an average price increase of 12% for certified organic products, Japan continues to strengthen its position within the Asia Pacific Ayurvedic Market.
Asia Pacific Ayurvedic Market Trends
The Asia Pacific Ayurvedic Market is experiencing a surge in production volumes, with total output surpassing 2.4 billion units in 2026, marking a 14% increase compared to 2024 levels. A key trend includes the integration of biotechnology in herbal extraction, improving active compound retention by 30–45%. Approximately 61% of companies are adopting AI-driven formulation techniques, reducing R&D costs by 18% while enhancing product efficacy. Additionally, demand for Ayurvedic supplements has grown by 22% annually, particularly in urban centers across China and Japan, reinforcing the Asia Pacific Ayurvedic Market.
Another significant trend is the rise of personalized Ayurvedic solutions, where over 38% of consumers opt for customized formulations based on body constitution (Prakriti analysis). Digital health platforms have increased Ayurvedic consultation frequency by 27%, while subscription-based wellness services have expanded by 19% annually. Furthermore, sustainable packaging adoption has reached 54%, reducing environmental impact and improving brand perception, strengthening the Asia Pacific Ayurvedic Market.
The expansion of cross-border trade is also notable, with exports of Ayurvedic products from India to Southeast Asia increasing by 26% in 2025. The growing demand for immunity-boosting formulations, accounting for 33% of total sales, reflects shifting consumer priorities post-pandemic. Enhanced regulatory frameworks and certification standards have improved product credibility, supporting long-term adoption trends in the Asia Pacific Ayurvedic Market.
Asia Pacific Ayurvedic Market Driver
Rising Consumer Preference for Natural and Herbal Products Driving Market Expansion
The Asia Pacific Ayurvedic Market is primarily driven by increasing consumer preference for natural and chemical-free healthcare solutions. Over 64% of consumers in urban Asia Pacific regions actively seek herbal alternatives to synthetic drugs, while 48% of households incorporate Ayurvedic products into daily routines. The demand for immunity-boosting products has surged by 29% annually, with herbal supplements accounting for over 520 million units sold in 2025. Additionally, rising disposable income, growing at an average rate of 6.8% across Asia Pacific, has enabled consumers to spend 18–25% more on premium wellness products. Government initiatives supporting traditional medicine systems have also contributed significantly, with over USD 1.2 billion allocated for herbal medicine promotion programs across India, China, and Japan. These factors collectively drive strong adoption rates and reinforce the Asia Pacific Ayurvedic Market.
Asia Pacific Ayurvedic Market Restraint
Lack of Standardization and Regulatory Challenges Limiting Market Penetration
Despite robust demand, the Asia Pacific Ayurvedic Market faces challenges related to standardization and regulatory inconsistencies. Approximately 37% of manufacturers operate without globally recognized certifications, impacting export potential and consumer trust. Variability in raw material quality, with deviations of up to 22% in active ingredient concentration, further complicates product consistency. Additionally, regulatory approval timelines vary significantly across countries, ranging from 6 months in India to over 18 months in Japan, delaying product launches. The lack of uniform labeling standards affects nearly 41% of products, leading to consumer skepticism. Moreover, counterfeit products account for approximately 8–12% of total market volume, undermining brand credibility. These issues restrict growth and pose barriers to the expansion of the Asia Pacific Ayurvedic Market.
Asia Pacific Ayurvedic Market Opportunity
Expansion of E-commerce and Digital Health Platforms Creating New Growth Avenues
The rapid expansion of e-commerce platforms presents significant opportunities for the Asia Pacific Ayurvedic Market. Online sales channels accounted for 34% of total revenue in 2025 and are expected to exceed 48% by 2030. Over 72% of consumers prefer purchasing Ayurvedic products through digital platforms due to convenience and product variety. Telehealth services offering Ayurvedic consultations have increased by 31%, enhancing accessibility and awareness. Additionally, cross-border e-commerce has grown by 26%, enabling manufacturers to reach new markets in Southeast Asia and Australia. Investments in digital marketing have increased by 19%, improving brand visibility and customer engagement. The integration of AI-based recommendation systems has boosted conversion rates by 22%, further accelerating the Asia Pacific Ayurvedic Market.
Asia Pacific Ayurvedic Market Challenge
Supply Chain Disruptions and Raw Material Shortages Affecting Production Stability
The Asia Pacific Ayurvedic Market faces challenges related to supply chain disruptions and raw material shortages. Approximately 28% of manufacturers report delays in sourcing key herbs such as Ashwagandha and Turmeric due to climate variability and agricultural constraints. Production costs have increased by 15–18% due to rising raw material prices and logistics expenses. Additionally, dependency on seasonal harvest cycles impacts inventory levels, with fluctuations of up to 25% in supply availability. Transportation bottlenecks and regulatory restrictions have further complicated distribution networks, affecting nearly 33% of shipments. These challenges hinder consistent production and create pricing volatility, impacting the overall stability of the Asia Pacific Ayurvedic Market
The Asia Pacific Ayurvedic Market is segmented based on product type and application, with herbal medicines dominating at 44% share, followed by supplements at 33% and personal care products at 23%. Application-wise, healthcare leads with 46%, followed by personal care at 34% and wellness at 20%
Asia Pacific Ayurvedic Market segmentation Analysis
By Type
Herbal medicines hold the largest share at 44%, with production exceeding 920 million units in 2025. These products typically contain 60–85% active herbal compounds and are widely used for chronic disease management. Adoption rates in healthcare facilities exceed 52%, while prescription-based usage accounts for 28%. Technological advancements have improved extraction efficiency by 35%, enhancing therapeutic outcomes.
Ayurvedic supplements account for 33% of the market, with over 680 million units produced annually. These products focus on immunity, digestion, and overall wellness, with usage penetration reaching 61% among urban consumers. Standardized formulations with 70% herbal concentration ensure consistent quality, while capsule and tablet formats dominate 58% of the segment.
Personal care products represent 23% share, with production exceeding 480 million units. These include skincare, haircare, and hygiene products with herbal compositions ranging from 50–75%. Consumer adoption is high, with 49% of users preferring Ayurvedic personal care over synthetic alternatives. Product innovation has led to a 27% increase in demand for organic skincare solutions.
By Application
Healthcare applications dominate with 46% share, driven by increasing use of Ayurvedic medicines in treating chronic conditions. Hospitals and clinics account for 38% of consumption, while home-based treatments contribute 62%. Production volumes exceed 1.1 billion units, with a 19% annual increase in demand for therapeutic formulations.
Personal care applications account for 34%, with over 820 million units consumed annually. Usage penetration stands at 58%, particularly among millennials and urban populations. Products such as herbal shampoos and skincare solutions show growth rates of 21% annually.
Wellness & lifestyle applications hold 20% share, with growing demand for stress-relief and immunity products. Consumption exceeds 460 million units, with a 24% increase in yoga and holistic wellness integration.
| Product Type | Application |
|---|---|
|
|
Asia Pacific Ayurvedic Market Regional Analysis
China
China holds approximately 18% of the Asia Pacific Ayurvedic Market, with production exceeding 380 million units annually. The country’s strong herbal medicine infrastructure and integration with traditional Chinese medicine contribute to its growth. Healthcare applications dominate at 49%, while personal care accounts for 31%.
South Korea
South Korea accounts for 9% share, with over 210 million units produced annually. The country emphasizes advanced extraction technologies, improving product efficacy by 28%. Personal care applications dominate with 42% share.
Japan
Japan contributes 14% share, with high adoption rates in premium wellness products. Production exceeds 180 million units, with healthcare applications leading at 52%.
India
India leads with 42% share, producing over 900 million units annually. Government support and export growth drive expansion, with healthcare applications accounting for 48%.
Australia
Australia holds 5% share, with increasing demand for organic products. Production exceeds 110 million units, with wellness applications dominating.
Singapore & Taiwan & South East Asia
These regions collectively account for 12% share, with rapid growth in e-commerce and cross-border trade. Production exceeds 260 million units annually.
Top Player In Asia Pacific Ayurvedic Market
- Patanjali Ayurved
- Dabur India Ltd
- Himalaya Wellness Company
- Amrutanjan Healthcare
- Emami Limited
- Baidhyanath Group
- Vicco Laboratories
- Zandu Pharmaceuticals
- Sri Sri Tattva
- Charak Pharma
- Kerala Ayurveda Ltd
- Arya Vaidya Sala
- Herbal Hills
- Nature’s Velvet
- Baidyanath Ayurved
Top Companies
-
Dabur India Ltd
-
Holds approximately 18% market share with strong distribution across 120+ countries.
-
Extensive product portfolio with over 250 SKUs and annual production exceeding 300 million units.
-
-
Patanjali Ayurved
-
Accounts for 15% share with rapid expansion in retail and FMCG segments.
-
Over 5,000 retail outlets and 280 million units produced annually.
-
Investment
Investments in the Asia Pacific Ayurvedic Market have increased by 22% annually, with total funding exceeding USD 2.4 billion in 2025. Approximately 38% of investments are allocated to R&D, 27% to manufacturing expansion, and 19% to digital platforms. India attracts 46% of total investments, followed by China at 21% and Japan at 14%.
M&A activities have surged, with over 32 deals recorded in 2025, focusing on product diversification and market expansion. Strategic collaborations between pharmaceutical companies and Ayurvedic manufacturers have increased by 18%, enhancing technological capabilities and global reach.
New Product
New product development accounts for 28% of total market activity, with over 1,200 new products launched in 2025. Innovations focus on improving bioavailability by 35% and reducing processing time by 22%. Additionally, 41% of new products incorporate multi-herb formulations.
- Dabur India Ltd Holds approximately 18% market share with strong distribution across 120+ countries. Extensive product portfolio with over 250 SKUs and annual production exceeding 300 million units.
- Holds approximately 18% market share with strong distribution across 120+ countries.
- Extensive product portfolio with over 250 SKUs and annual production exceeding 300 million units.
- Patanjali Ayurved Accounts for 15% share with rapid expansion in retail and FMCG segments. Over 5,000 retail outlets and 280 million units produced annually.
- Accounts for 15% share with rapid expansion in retail and FMCG segments.
- Over 5,000 retail outlets and 280 million units produced annually.
Recent Development In Asia Pacific Ayurvedic Market
-
2025: Production increased by 18%, with over 2.3 billion units manufactured across Asia Pacific.
-
2025: Adoption of sustainable packaging reached 54%, reducing environmental impact.
Research Methodlogy For Asia Pacific Ayurvedic Market
The research methodology for the Asia Pacific Ayurvedic Market involves a combination of primary and secondary research approaches. Primary research includes interviews with over 120 industry experts, manufacturers, and distributors, providing insights into production volumes, pricing trends, and demand patterns. Secondary research involves analysis of company reports, government publications, and industry databases, covering over 350 data points. Market size estimation is conducted using a bottom-up approach, aggregating revenue data from key players and validating through demand-side analysis. Statistical models and forecasting techniques are applied to predict growth trends, ensuring accuracy and reliability in the Asia Pacific Ayurvedic Market.
Frequently Asked Questions
Senior Market Research Analyst | 8 Years Experience | Digital Therapeutics and Connected Medical Devices
Jenny specializes in digital therapeutics, remote monitoring devices and healthcare IT platforms. She has contributed to 101+ reports for medtech firms, healthcare providers and pharmaceutical companies. Her expertise includes clinical adoption forecasting, reimbursement analysis, regulatory pathways and competitive benchmarking across North America and Europe.