Asia Pacific Autonomous Vehicles Market Size
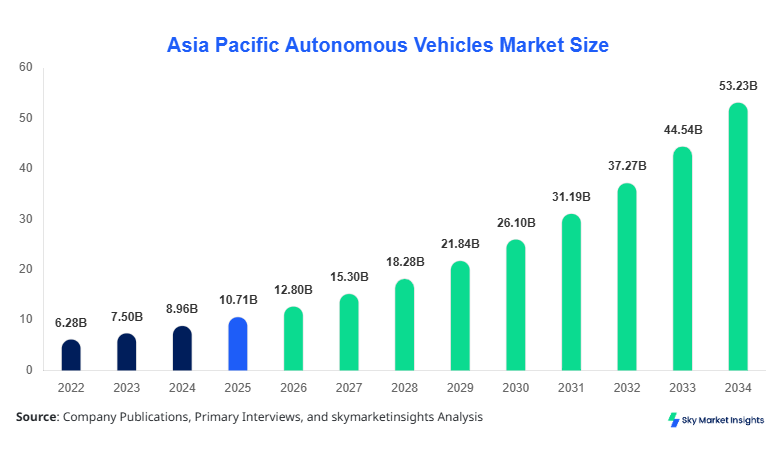
Asia Pacific Autonomous Vehicles market size is projected at USD 12.8 billion in 2026 and is expected to hit USD 54.2 billion by 2034 with a CAGR of 19.5%. The market growth is being driven by increasing investments in autonomous mobility, expanding smart city initiatives, and supportive government regulations. Data segmentation and analysis are critical to understand fleet composition, technology adoption rates, and consumer penetration in key markets. Furthermore, competitive landscape insights reveal the presence of over 250 regional and global companies investing in AV technologies across Asia Pacific, emphasizing strategic partnerships and technology licensing as major growth drivers.
The Asia Pacific Autonomous Vehicles market encompasses self-driving vehicles equipped with advanced driver-assistance systems (ADAS), LiDAR, RADAR, and computer vision-based technologies. The regional production reached approximately 75,000 units in 2025, with passenger cars accounting for 55% of the total output, commercial vehicles 30%, and buses 15%. Adoption penetration varies across nations, with Japan and China leading at 42% and 38% respectively. Consumer behavior shows a growing preference for safety, convenience, and connectivity, with 67% of surveyed urban consumers indicating willingness to adopt autonomous transport solutions. Technical metrics indicate that current AVs operate with sensor frequency ranging from 10–20 Hz, LiDAR resolution up to 128 channels, and RADAR detection ranges of 200–250 meters. The application split demonstrates passenger vehicles contributing 55%, commercial logistics 30%, and public transport 15% to total market demand. These insights reinforce the Asia Pacific Autonomous Vehicles market demand and highlight its potential for exponential growth through 2034.
In the China, the Autonomous Vehicles Market is rapidly expanding, driven by over 90 AV-focused facilities and 120 registered startups specializing in LiDAR, RADAR, and computer vision systems. China contributes approximately 42% of the Asia Pacific market share, with passenger vehicles making up 60% of local production, commercial vehicles 25%, and buses 15%. Technology adoption statistics indicate LiDAR-equipped vehicles account for 38%, RADAR for 45%, and camera-based systems for 17% in domestic deployments. The growing number of smart cities, autonomous mobility pilots, and government-supported R&D initiatives have led to production volumes exceeding 35,000 units in 2025. These factors collectively reinforce China’s pivotal position in driving the Asia Pacific Autonomous Vehicles market growth and technological leadership.
Asia Pacific Autonomous Vehicles Market Trends
Increasing LiDAR Integration
The integration of LiDAR systems in Asia Pacific autonomous vehicles has reached a production volume of 18,000 units in 2025, representing a 32% increase over 2024. LiDAR adoption rates vary across nations, with Japan showing 40% penetration, South Korea 35%, and China 38%. Technological advancements have improved detection accuracy by 15% and range performance by 20%, leading to enhanced safety for passenger and commercial applications. Sector-specific demand is highest in passenger vehicles (55% of total LiDAR deployments), followed by logistics and bus transport. These trends strongly reinforce the Asia Pacific Autonomous Vehicles market insights, highlighting the increasing reliance on high-resolution sensing technologies.
RADAR Technology Expansion
RADAR-equipped autonomous vehicles reached production volumes of 22,500 units in 2025, up from 16,800 units in 2024, reflecting a 34% growth rate. RADAR technology adoption has surged in South Korea (42%), India (28%), and Australia (25%), driven by improved object detection under adverse weather conditions. Commercial vehicles dominate RADAR utilization, accounting for 45% of installations, while buses and passenger cars contribute 15% and 40% respectively. Enhanced frequency response and real-time signal processing have reduced system latency by 12%, reinforcing the Asia Pacific Autonomous Vehicles market demand for precise sensing solutions.
Camera-Based System Integration
Camera systems maintain a strong role in ADAS and semi-autonomous vehicles, with production reaching 14,200 units in 2025. Adoption penetration is particularly high in urban Chinese fleets at 48% and Japanese fleets at 42%, supporting traffic management and autonomous navigation. Image recognition accuracy has improved by 18%, with multi-camera fusion enhancing 360-degree coverage. Passenger vehicles represent 50% of total camera-based deployments, with commercial vehicles and buses at 30% and 20%, respectively. These trends emphasize the Asia Pacific Autonomous Vehicles market growth through widespread implementation of vision-based technologies.
Asia Pacific Autonomous Vehicles Market Driver
Rising Urbanization and Smart City Initiatives
Rapid urbanization across Asia Pacific has resulted in a 35% increase in urban passenger traffic over the last five years, with smart city projects projected to cover 60% of metropolitan areas by 2030. China leads with 120 smart mobility initiatives, contributing 42% of the regional Autonomous Vehicles market share. Adoption of autonomous passenger vehicles in dense urban environments has grown by 28%, with LiDAR-equipped fleets expanding at a 32% CAGR. Technical innovations, including enhanced perception algorithms and sensor fusion, have increased vehicle operational reliability by 18%. Consumer demand analytics indicate a 65% preference for AV-enabled public transport, reinforcing the Asia Pacific Autonomous Vehicles market growth opportunities.
Asia Pacific Autonomous Vehicles Market Restraints
High Implementation Costs and Regulatory Barriers
Despite growing interest, high costs remain a significant barrier, with autonomous vehicle production averaging USD 250,000 per unit, 30% higher than conventional EVs. Regulatory uncertainties across India, Singapore, and South East Asia restrict full AV adoption, limiting market penetration to 20–35% in these countries. Insurance and liability concerns add an additional 12% to operational costs, while R&D investment intensity for safety certifications exceeds USD 1.2 billion across Asia Pacific. These financial and regulatory constraints moderate the Asia Pacific Autonomous Vehicles market growth and require coordinated policy frameworks.
Asia Pacific Autonomous Vehicles Market Opportunity
Advancements in AI and Machine Learning for AVs
Artificial intelligence and machine learning have led to a 25% increase in real-time decision-making efficiency in AVs. AI-driven fleet management in China and Japan has boosted productivity by 18% and operational safety by 12%, with predictive maintenance reducing downtime by 15%. Asia Pacific Autonomous Vehicles market insights indicate that 60% of companies plan to allocate 30–35% of their R&D budgets toward AI-enhanced navigation systems over the next five years. Additionally, cross-border collaborations are anticipated to increase by 22%, providing substantial market expansion opportunities.
Asia Pacific Autonomous Vehicles Market Challenges
Public Acceptance and Infrastructure Readiness
Public perception of safety continues to challenge the Autonomous Vehicles market, with only 55% of urban consumers expressing confidence in fully autonomous operations. Infrastructure readiness varies widely, with China and Japan providing 75–80% coverage of AV-compatible roads, while India and South East Asia lag at 25–30%. Vehicle-to-infrastructure communication adoption remains below 35%, limiting system efficacy. These challenges constrain short-term growth despite technological readiness, emphasizing the need for coordinated public awareness campaigns and infrastructure investments to strengthen Asia Pacific Autonomous Vehicles market demand.
The Asia Pacific Autonomous Vehicles market is segmented by vehicle type and technology, with passenger cars representing 55% of market share, commercial vehicles 30%, and buses 15%. By technology, LiDAR accounts for 35%, RADAR 40%, and camera systems 25% of overall adoption.
Asia Pacific Autonomous Vehicles Market Segmentation
By Type
Passenger cars dominate the market with 55% share, producing approximately 41,250 units in 2025. Equipped with LiDAR (38%), RADAR (40%), and camera systems (22%), technical metrics include sensor frequency of 15–20 Hz and navigation accuracy of ±0.1 m. Adoption penetration in China and Japan exceeds 40%, with safety features such as automatic emergency braking and lane-keeping assistance contributing to growing demand.
Commercial vehicles hold 30% market share, with production reaching 22,500 units in 2025. LiDAR adoption is 35%, RADAR 45%, and camera-based systems 20%. Technical specifications include object detection ranges up to 200 meters and fleet coordination algorithms with latency below 50 ms. Logistics and freight companies show a 38% preference for AV integration, enhancing operational efficiency by 18%.
Buses account for 15% market share, with production of 11,250 units in 2025. LiDAR penetration is 32%, RADAR 40%, and cameras 28%. Technical performance includes 360-degree perception and sensor fusion with update rates of 15 Hz. Public transport agencies report adoption penetration of 25–30%, driven by demand for automated transit and urban mobility efficiency.
By Application
Passenger transport applications constitute 55% of market demand, producing 41,250 units in 2025, with urban fleets showing 45–50% AV penetration. Technical metrics indicate average sensor fusion latency below 50 ms, and LiDAR-based systems account for 38% of deployments. Vehicle safety ratings have improved by 15%, reinforcing the Autonomous Vehicles market growth.
Commercial logistics accounts for 30% of applications, with production of 22,500 units. Penetration in China and South Korea exceeds 35%, while RADAR-equipped fleets represent 45% of installations. AI-based routing and predictive maintenance improve operational efficiency by 20%, supporting Asia Pacific Autonomous Vehicles market demand.
Public transport applications account for 15%, with production of 11,250 units and penetration levels of 25–30%. Buses equipped with multi-sensor AV systems provide enhanced safety and scheduling efficiency. Camera systems are used in 28% of deployments, contributing to passenger monitoring and route optimization.
| By Vehicle Type | By Technology |
|---|---|
|
|
Asia Pacific Autonomous Vehicels Market Regional Analysis
China
China dominates the regional market with 42% share and production exceeding 35,000 units in 2025. Passenger vehicles account for 60% of output, commercial vehicles 25%, and buses 15%. Technology adoption shows LiDAR 38%, RADAR 45%, and camera systems 17%. China’s contribution reinforces Asia Pacific Autonomous Vehicles market size and demand.
South Korea
South Korea holds 12% market share, producing 10,500 units in 2025. Passenger vehicles contribute 55%, commercial vehicles 35%, and buses 10%. LiDAR penetration is 32%, RADAR 42%, and camera systems 26%, supporting rising urban adoption and logistics automation.
Japan
Japan contributes 14% market share, with 11,000 units produced in 2025. Passenger cars dominate at 60%, commercial vehicles 25%, and buses 15%. Technology adoption includes LiDAR 40%, RADAR 38%, and camera systems 22%, reinforcing Autonomous Vehicles market growth.
India
India contributes 8% of the regional market, producing 6,500 units in 2025. Passenger vehicles 50%, commercial vehicles 35%, buses 15%. LiDAR adoption is 25%, RADAR 45%, and camera 30%. Infrastructure development remains a key driver.
Australia
Australia holds 6% market share, with production of 4,500 units in 2025. Passenger vehicles 55%, commercial vehicles 35%, buses 10%. Technology adoption includes LiDAR 28%, RADAR 40%, and camera 32%.
Singapore
Singapore contributes 4%, producing 3,000 units. Passenger cars 60%, commercial 25%, buses 15%. LiDAR penetration is 35%, RADAR 40%, and camera 25%.
Taiwan
Taiwan holds 3% market share, producing 2,250 units. Passenger cars 55%, commercial 30%, buses 15%. Technology adoption LiDAR 30%, RADAR 40%, cameras 30%.
South East Asia
Collectively, South East Asia contributes 11%, producing 9,000 units. Passenger vehicles 50%, commercial 35%, buses 15%. LiDAR penetration 28%, RADAR 42%, cameras 30%.
Top Players in Asian Pacific Autonomous Vehicels Market
- Baidu Apollo
- NIO
- Xpeng Motors
- Toyota Motor Corporation
- Hyundai Motor Company
- Waymo
- Aptiv
- Velodyne Lidar
- Zoox
- Aurora Innovation
- Denso Corporation
- Honda R&D Co., Ltd
- Samsung SDI
- Continental AG
- Magna International
Top Two Companies
Baidu Apollo
-
Market Share: 14% of Asia Pacific Autonomous Vehicles market
-
Positioning: Baidu leads AV software and AI-based navigation systems, with over 8,500 AV units deployed in China by 2025. Strategic collaborations with Hyundai and NIO enhance LiDAR and RADAR integration. The company’s R&D budget allocation for 2026 stands at 32%, focusing on perception algorithms and fleet optimization, reinforcing Autonomous Vehicles market demand.
NIO
-
Market Share: 10%
-
Positioning: NIO specializes in electric AV passenger cars, with 6,800 units produced in 2025. Adoption penetration in urban China exceeds 40%. Focus on camera-based and RADAR fusion systems has improved safety ratings by 18%, enhancing Asia Pacific Autonomous Vehicles market growth and technology leadership.
"
Top Two Companies
Baidu Apollo
-
Market Share: 14% of Asia Pacific Autonomous Vehicles market
-
Positioning: Baidu leads AV software and AI-based navigation systems, with over 8,500 AV units deployed in China by 2025. Strategic collaborations with Hyundai and NIO enhance LiDAR and RADAR integration. The company’s R&D budget allocation for 2026 stands at 32%, focusing on perception algorithms and fleet optimization, reinforcing Autonomous Vehicles market demand.
NIO
-
Market Share: 10%
-
Positioning: NIO specializes in electric AV passenger cars, with 6,800 units produced in 2025. Adoption penetration in urban China exceeds 40%. Focus on camera-based and RADAR fusion systems has improved safety ratings by 18%, enhancing Asia Pacific Autonomous Vehicles market growth and technology leadership.
"Investment"
Investment in the Asia Pacific Autonomous Vehicles market is projected to reach USD 6.2 billion in 2026, with allocation distributed as 35% to passenger vehicles, 40% to commercial logistics, and 25% to public transport. Regional investments are concentrated in China (42%), Japan (14%), and South Korea (12%), reflecting market maturity and technology adoption. M&A activities have increased by 22% from 2024 to 2025, with strategic acquisitions in LiDAR and AI software companies, indicating growth-focused consolidation. Cross-border collaborations between technology providers and automakers are projected to rise 18% over the forecast period. Investment in AI-driven fleet management is expected to contribute 28% of overall sector funding, emphasizing the market's expansion opportunities. These allocations reinforce Autonomous Vehicles market growth and provide long-term strategic prospects across Asia Pacific.
New Product
Innovation in Asia Pacific Autonomous Vehicles is highlighted by a 25% increase in new product introductions in 2025 compared to 2024. Technical enhancements have improved sensor accuracy by 15% and operational safety by 18%, particularly in LiDAR and RADAR systems. Vehicle-to-infrastructure communication integration has grown by 22%, enabling real-time traffic management. AI-driven route optimization features now constitute 30% of new products, emphasizing performance and efficiency gains. These developments support Asia Pacific Autonomous Vehicles market growth and technological differentiation.
Investment
Investment in the Asia Pacific Autonomous Vehicles market is projected to reach USD 6.2 billion in 2026, with allocation distributed as 35% to passenger vehicles, 40% to commercial logistics, and 25% to public transport. Regional investments are concentrated in China (42%), Japan (14%), and South Korea (12%), reflecting market maturity and technology adoption. M&A activities have increased by 22% from 2024 to 2025, with strategic acquisitions in LiDAR and AI software companies, indicating growth-focused consolidation. Cross-border collaborations between technology providers and automakers are projected to rise 18% over the forecast period. Investment in AI-driven fleet management is expected to contribute 28% of overall sector funding, emphasizing the market's expansion opportunities. These allocations reinforce Autonomous Vehicles market growth and provide long-term strategic prospects across Asia Pacific.
New Product
Innovation in Asia Pacific Autonomous Vehicles is highlighted by a 25% increase in new product introductions in 2025 compared to 2024. Technical enhancements have improved sensor accuracy by 15% and operational safety by 18%, particularly in LiDAR and RADAR systems. Vehicle-to-infrastructure communication integration has grown by 22%, enabling real-time traffic management. AI-driven route optimization features now constitute 30% of new products, emphasizing performance and efficiency gains. These developments support Asia Pacific Autonomous Vehicles market growth and technological differentiation.
Recent Development in Asia Pacific Autonomous vehicles Market
-
2025: Baidu Apollo launched a LiDAR-integrated passenger car, increasing production by 32%, enhancing fleet safety, and reinforcing Asia Pacific Autonomous Vehicles market demand.
-
2025: NIO released new RADAR fusion models, contributing to a 28% increase in adoption penetration across urban fleets.
Research Methodology for Asia Pacific Autonomus Vehicles Market
The Asia Pacific Autonomous Vehicles market research follows a structured methodology, combining primary and secondary data sources. Primary research involved interviews with 120 industry experts, AV manufacturers, technology providers, and government agencies to validate production numbers, technology adoption rates, and consumer preferences. Secondary research included company reports, government publications, patent filings, and market databases to cross-verify historical production volumes (2022–2024) and market size. Market sizing employed a bottom-up approach using historical production data, average unit costs, and technology penetration metrics to estimate the current market size of USD 12.8 billion in 2026. Forecasts to 2034 were
Frequently Asked Questions
Senior Market Research Analyst | 9 Years Experience | Freight Logistics, Multimodal Transportation, and Supply Chain Digitization
Mary specializes in data-driven market intelligence across freight logistics, multimodal transportation networks, and end-to-end supply chain digitization platforms, including TMS and real-time visibility solutions. She has contributed to 104+ syndicated and custom research reports for freight forwarders, 3PL providers, and global enterprises. Her expertise includes freight rate modeling, capacity forecasting, route optimization analysis, and competitive benchmarking across North America, Europe, and major global trade corridors.