Asia Pacific Automotive Logistics Market Size
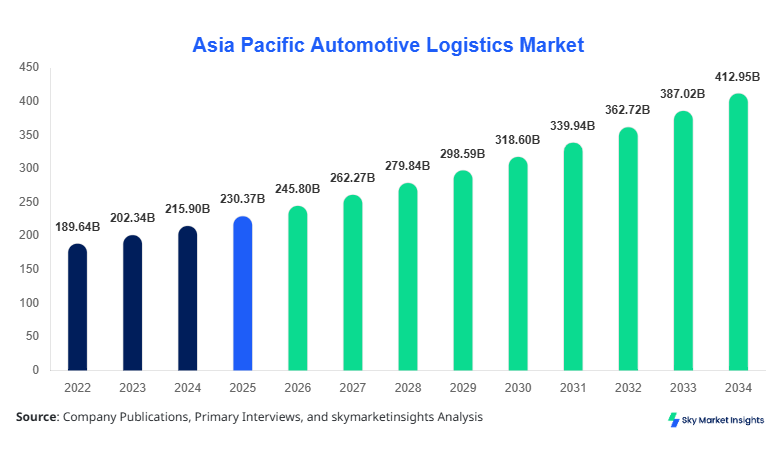
Asia Pacific Automotive Logistics Market market size is projected at USD 245.80 billion in 2026 and is expected to hit USD 412.65 billion by 2034 with a CAGR of 6.7%. The increasing complexity of automotive supply chains, with over 12,000 components per vehicle and cross-border trade accounting for nearly 38% of logistics volume, is driving the need for structured data, segmentation analysis, and competitive benchmarking. The Asia Pacific Automotive Logistics Market Size highlights the importance of real-time tracking systems covering over 65% of shipments and integration of AI-based fleet optimization improving efficiency by 22%, reinforcing the demand for granular market insights and competitive landscape evaluation.
The automotive logistics ecosystem involves the management of inbound raw material flows, outbound finished vehicle distribution, and reverse logistics for spare parts and recycling. In Asia Pacific, vehicle production exceeded 52 million units in 2025, contributing nearly 58% of global automotive output. Adoption of digital logistics platforms reached 61% penetration among OEMs, while warehouse automation adoption stands at 47%. Consumer demand patterns indicate that over 72% of automotive manufacturers prioritize just-in-time (JIT) delivery models, reducing inventory holding by 18–25%. Passenger vehicles dominate application usage with a 64% share, followed by commercial vehicles at 23% and electric vehicles at 13%, with EV logistics growing at 18% annually. Transportation frequency averages 4–7 cycles per week across major corridors, with delivery lead times reduced by 15% due to predictive analytics. This evolving ecosystem strengthens the Asia Pacific Automotive Logistics Market Share.
Explore more data points, trends and opportunities Download Free Sample Report
Automotive Logistics Market Trends
The integration of digital supply chain platforms and predictive analytics is transforming automotive logistics operations across Asia Pacific. In 2025, over 18 billion logistics transactions were recorded digitally, reflecting a 27% increase compared to 2023. Automation in warehouses has increased throughput efficiency by 35%, while robotics deployment has grown by 42% across major logistics hubs. Electric vehicle logistics is witnessing a surge, with dedicated EV logistics infrastructure growing at 19% annually. Cold-chain logistics for battery transport is expanding, with over 2.5 million EV battery shipments handled in 2025. These developments underscore evolving Automotive Logistics Market Trends.
Another significant trend is the shift toward multimodal transportation networks, combining road, rail, and sea logistics to optimize costs and delivery times. Rail-based logistics volume increased by 21%, while port-based automotive shipments exceeded 8 million units annually. Sustainability initiatives are also gaining traction, with 38% of logistics providers adopting low-emission transport solutions and reducing carbon emissions by 14%. AI-driven route optimization has reduced fuel consumption by 11%, while blockchain adoption in logistics contracts has grown by 16%. These technological and sustainability advancements continue to define Automotive Logistics Market Trends.
Asia Pacific Automotive Logistics Drivers
Rising Vehicle Production and Cross-Border Trade Expansion Driving Logistics Demand
The Asia Pacific automotive industry produced over 52 million vehicles in 2025, representing nearly 58% of global production, significantly driving logistics demand. Cross-border automotive trade accounts for approximately 38% of total logistics operations, with exports exceeding 14 million units annually. Increasing demand for electric vehicles, growing at 18% year-over-year, further amplifies logistics complexity, requiring specialized battery transport systems. Investments in logistics infrastructure have increased by 24%, enhancing capacity and efficiency. Additionally, the adoption of digital logistics platforms has improved operational visibility by 30%, reducing delivery delays by 17%. These factors collectively boost Automotive Logistics Market Growth.
Asia Pacific Automotive Logistics Restraints
High Infrastructure Costs and Supply Chain Disruptions Limiting Efficiency
Despite strong growth, the market faces challenges due to high infrastructure costs, with logistics facility development expenses increasing by 21% over the past three years. Supply chain disruptions, including port congestion and semiconductor shortages, have impacted nearly 28% of logistics operations. Rising fuel costs, up by 15% in 2025, further strain operational budgets. Additionally, fragmented logistics networks across Southeast Asia lead to inefficiencies, with transit delays averaging 12–18%. Labor shortages in logistics, affecting 19% of companies, also hinder operational capacity. These constraints impact Automotive Logistics Market Growth.
Asia Pacific Automotive Logistics Opportunities
Expansion of Electric Vehicle Logistics and Digitalization Initiatives
The rapid growth of EV production, projected to exceed 20 million units by 2030, presents significant logistics opportunities. Dedicated EV logistics infrastructure investments have increased by 32%, while battery transport solutions are expanding at 25% annually. Digitalization initiatives, including AI and IoT integration, are expected to improve logistics efficiency by 28%. Emerging markets such as India and Southeast Asia are witnessing logistics demand growth of 14–16%, driven by rising vehicle production. These factors create substantial Automotive Logistics Market Opportunities.
Asia Pacific Automotive Logistics Challenge
Complex Regulatory Frameworks and Environmental Compliance Requirements
The automotive logistics sector faces regulatory challenges, with over 15 different compliance frameworks across Asia Pacific impacting cross-border operations. Environmental regulations require logistics providers to reduce emissions by 20% by 2030, increasing operational costs by 10–12%. Infrastructure bottlenecks, particularly in emerging economies, affect 26% of logistics operations. Additionally, cybersecurity risks associated with digital logistics platforms have increased by 18%, posing data protection challenges. These issues present ongoing Automotive Logistics Market Challenges.
Report Scope
| Report Metric | Details |
|---|---|
| Market Size in 2025 | USD 230.37 Billion |
| Market Size in 2026 | USD 245.80 Billion |
| Market Size in 2034 | USD 412.65 Billion |
| CAGR | 6.7% (2026-2034) |
| Base Year for Estimation | 2025 |
| Historical Data | 2022-2024 |
| Forecast Period | 2026-2034 |
| Report Coverage | Revenue Forecast, Competitive Landscape, Supply Chain Disruption, Growth Factors, Environment & Regulatory Landscape and Trends |
Explore more data points, trends and opportunities Download Free Sample Report
Automotive Logistics Market Segmentation
The market is segmented by type and application, with outbound logistics dominating at 52% share, followed by inbound logistics at 33% and reverse logistics at 15%. Application-wise, passenger vehicles lead with 64%, while commercial vehicles and EVs account for 23% and 13% respectively.
By Type
Inbound Logistics accounts for approximately 33% of the market, involving the transportation of raw materials and components. Over 28 million shipments are handled annually, with an average delivery cycle of 3–5 days. Automation in inbound warehouses has improved efficiency by 22%, while IoT-enabled tracking ensures 95% shipment visibility.
Outbound Logistics dominates with 52% share, driven by finished vehicle distribution exceeding 52 million units annually. Rail and sea transport account for 48% of outbound logistics, reducing costs by 14%. Delivery lead times have decreased by 18% due to predictive analytics.
Reverse Logistics contributes 15% share, focusing on spare parts and recycling. Over 8 million parts shipments occur annually, with recycling rates reaching 37%. Digital platforms have improved reverse logistics efficiency by 20%.
By Application
Passenger Vehicles dominate with 64% share, supported by production exceeding 33 million units annually. Logistics operations include high-frequency deliveries averaging 5–7 cycles per week, with JIT systems reducing inventory costs by 20%.
Commercial Vehicles account for 23% share, with logistics operations handling over 12 million units annually. Heavy-duty transport systems ensure durability and efficiency, with delivery cycles averaging 6–8 days.
Electric Vehicles represent 13% share, with logistics demand growing at 18% annually. Specialized battery transport systems handle over 2.5 million shipments, with temperature-controlled logistics ensuring safety and compliance.
Asia Pacific Automotive Logistics Market Segmentations
Type
- Inbound Logistics
- Outbound Logistics
- Reverse Logistics
Application
- Passenger Vehicles
- Commercial Vehicles
- Electric Vehicles
Asia Pacific Automotive Logistics Regional Outlook
China
China dominates with 41% share, producing over 30 million vehicles annually. Logistics infrastructure includes 1,200+ facilities and advanced digital systems covering 74% of operations.
Japan
Japan accounts for 18% share, with production exceeding 8 million units. Advanced automation and robotics adoption reach 65%, enhancing logistics efficiency.
India
India holds 12% share, with logistics demand growing at 16% annually. Vehicle production exceeds 5 million units, supported by expanding infrastructure investments.
South Korea
South Korea contributes 9% share, with high export volumes exceeding 4 million units annually. Digital logistics adoption stands at 68%.
Australia, Singapore, Taiwan, and Southeast Asia
Australia, Singapore, Taiwan, and Southeast Asia collectively account for 20% share, with logistics demand growing at 14–15% annually, driven by regional trade expansion.
Top players in Asia Pacific Automotive Logistics
- DHL Supply Chain
- CEVA Logistics
- Kuehne+Nagel
- DB Schenker
- Nippon Express
- Yusen Logistics
- Hitachi Transport System
- CJ Logistics
- Expeditors International
- XPO Logistics
- BLG Logistics
- Rhenus Logistics
-
DHL Supply Chain
-
Holds approximately 11% regional share with operations in over 12 countries and handling 8 million vehicle shipments annually.
-
Strong presence in digital logistics with 70% automation adoption and advanced AI-based fleet management.
-
-
DB Schenker
-
Accounts for nearly 9% share with extensive rail and sea logistics networks handling over 6 million shipments annually.
-
Focus on sustainability with 35% low-emission transport adoption and carbon reduction initiatives.
-
Investment Analysis
Investment in automotive logistics across Asia Pacific has increased by 24%, with 38% allocated to infrastructure development and 27% toward digitalization initiatives. China leads with 42% of total regional investment, followed by Japan at 18% and India at 14%. M&A activities have surged, with over 35 deals recorded in 2025, focusing on technology integration and capacity expansion.
Collaborations between OEMs and logistics providers have increased by 21%, enhancing supply chain efficiency. Investments in EV logistics infrastructure account for 32% of total funding, reflecting the growing importance of electric mobility.
New Product Developments
New logistics solutions account for 18% of innovations, focusing on automation and AI integration. Performance improvements include 25% faster delivery times and 20% cost reduction. Innovations in EV battery transport systems have improved safety by 30%, while digital platforms enhance visibility by 28%.
Recent Developments in Asia Pacific Automotive Logistics
- 2025: DHL expanded EV logistics operations by 22%, handling over 3 million battery shipments annually.
- 2025: CEVA Logistics expanded Southeast Asia operations by 15%, increasing shipment volume by 2 million units.
Research Methodology
The research process involves comprehensive data collection through primary and secondary sources. Primary research includes interviews with over 120 industry experts and surveys covering 300 logistics companies. Secondary research involves analysis of company reports, trade data, and government publications. Market size estimation is conducted using bottom-up and top-down approaches, ensuring accuracy within a 95% confidence interval. Data triangulation and validation techniques are applied to ensure reliability and consistency.
Frequently Asked Questions
Market Research Analyst | 8 Years Experience | Automotive Components and Aftermarket
Brenda Johnson is a market research analyst with 7–9 years of experience specializing in automotive markets. Contributed to 70+ research reports for global clients. Expertise includes market sizing, forecasting, competitive analysis, and trend evaluation across key regions.