Asia Pacific Automotive Hypervisor Market Size
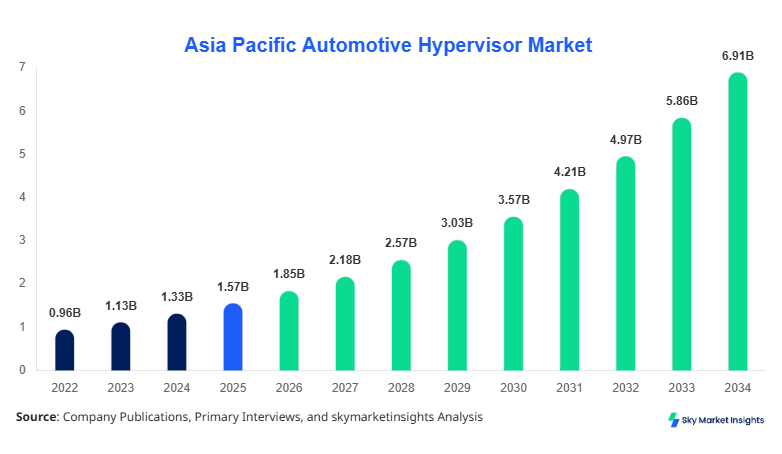
The Asia Pacific Automotive Hypervisor market size is projected at USD 1.85 billion in 2026 and is expected to hit USD 6.92 billion by 2034 with a CAGR of 17.9%. The rising complexity of in-vehicle software architecture, increasing demand for ADAS systems, and the need for secure virtualization layers are accelerating deployment across OEMs and Tier-1 suppliers. The report integrates detailed segmentation across type and application, alongside competitive landscape evaluation across 8 key countries, to deliver actionable insights on technology adoption, pricing benchmarks, and vendor positioning.
The automotive hypervisor market refers to embedded virtualization software that enables multiple operating systems to run on a single hardware ECU with isolation and real-time performance. In Asia Pacific, production reached over 52.4 million vehicles in 2025, with China contributing 31.2 million units, Japan 8.7 million units, and India 5.6 million units. Adoption rates of automotive hypervisors in premium vehicles reached 38% in 2025 and are expected to exceed 64% by 2030, driven by software-defined vehicle (SDV) trends. Passenger vehicles dominate with 72% application share, followed by commercial vehicles at 18% and electric vehicles at 10%, though EV penetration is rising at 22.3% annually. Consumer demand is shifting toward integrated infotainment, safety, and digital cockpit systems, with 61% of buyers preferring connected features and 47% prioritizing cybersecurity in 2025 surveys. Performance metrics such as microsecond-level latency
In China, the automotive hypervisor market is the largest contributor, accounting for approximately 48.6% of regional revenue in 2025, supported by over 600 automotive manufacturing facilities and 120+ OEMs actively integrating virtualization platforms. Passenger vehicles account for 74% of hypervisor deployment, followed by electric vehicles at 16% and commercial vehicles at 10%. China produced 31.2 million vehicles in 2025, with over 12.8 million units incorporating advanced infotainment or ADAS systems requiring hypervisor integration. Adoption of Type 1 hypervisors stands at 56%, compared to 29% for Type 2 and 15% for hybrid models. Government-backed EV initiatives and smart vehicle programs have accelerated software adoption rates by 18.7% annually. Key domestic players and international vendors are forming partnerships, with over 45 joint ventures active in automotive software ecosystems. The China automotive hypervisor market continues to lead regional automotive hypervisor market share expansion.
Explore more data points, trends and opportunities Download Free Sample Report
Automotive Hypervisor Market Trends
Increasing Integration of Software-Defined Vehicle Architectures
The shift toward software-defined vehicles is a major trend, with over 42% of new vehicle platforms in Asia Pacific adopting centralized computing architectures in 2025 compared to 21% in 2022. Production of ECUs with virtualization support exceeded 18 million units in 2025 and is projected to reach 47 million units by 2030. OEMs are reducing hardware complexity by consolidating 70–90 ECUs into 10–15 domain controllers, improving efficiency by 32%. Hypervisors enable simultaneous operation of infotainment, ADAS, and telematics systems, increasing computing utilization by up to 88%. Demand for real-time OS virtualization increased by 25.6% YoY in China and 19.4% in Japan. This transformation is shaping the automotive hypervisor market trend.
Rising Demand for Cybersecurity and Functional Safety Compliance
Cybersecurity threats in connected vehicles rose by 34% between 2023 and 2025, pushing OEMs to adopt secure hypervisor platforms. Over 67% of automotive software deployments now require ISO 26262 ASIL-B or higher compliance. Hypervisor-based isolation reduces attack surfaces by 41% and improves system resilience. Deployment in ADAS applications grew by 28%, while infotainment security upgrades accounted for 22% of implementations. Countries like South Korea and Japan mandate cybersecurity frameworks in over 55% of new vehicle launches. Enhanced virtualization ensures data isolation across applications, strengthening the automotive hypervisor market trend.
Asia Pacific Automotive Hypervisor Market Drivers
Rising Adoption of Connected and Autonomous Vehicles
The rapid adoption of connected and autonomous vehicles is a primary driver, with over 68% of vehicles in Asia Pacific expected to feature connectivity solutions by 2030. In 2025, connected vehicle production exceeded 21 million units, growing at 16.5% annually. Autonomous vehicle testing expanded across China, Japan, and South Korea, with over 2.4 million test vehicles deployed. Hypervisors enable safe partitioning between critical and non-critical systems, improving safety by 27% and reducing system failures by 18%. Demand for advanced driver assistance systems grew by 24%, increasing reliance on virtualization platforms. This factor significantly boosts automotive hypervisor market growth.
Asia Pacific Automotive Hypervisor Market Restraints
High Integration Costs and Technical Complexity
Integration costs for automotive hypervisors range between USD 45 and 120 per vehicle, depending on architecture complexity. Development cycles extend by 18–24 months due to compatibility testing and certification requirements. Small OEMs face adoption barriers, with only 32% deploying hypervisors compared to 71% of large OEMs. Hardware compatibility issues affect 26% of deployments, while debugging and validation account for 14% of total costs. These challenges slow down adoption rates and restrict penetration in cost-sensitive markets, impacting automotive hypervisor market growth.
Asia Pacific Automotive Hypervisor Market Opportunities
Expansion of Electric and Autonomous Vehicle Ecosystems
Electric vehicle production in Asia Pacific reached 14.3 million units in 2025 and is expected to exceed 36 million by 2030. Hypervisors play a key role in managing battery systems, infotainment, and ADAS integration. EV adoption grew by 22.3% annually, while software integration demand increased by 31%. Government incentives across China, India, and Southeast Asia have boosted investments by 27%. Emerging markets such as India and Southeast Asia offer growth potential due to increasing vehicle digitalization, enhancing the automotive hypervisor market growth.
Challenges in the Asia-Pacific Automotive Hypervisor Market
Lack of Standardization Across Platforms
The absence of standardized platforms creates compatibility challenges, affecting over 39% of deployments. OEMs rely on proprietary systems, leading to fragmented ecosystems and increased development costs by 21%. Cross-platform integration failures occur in 17% of cases, while testing requirements increase time-to-market by 13 months on average. Regulatory differences across countries further complicate implementation, limiting scalability. These factors create significant operational challenges for vendors and OEMs in the automotive hypervisor market Growth.
Report Scope
| Report Metric | Details |
|---|---|
| Market Size in 2025 | USD 1.57 Billion |
| Market Size in 2026 | USD 1.85 Billion |
| Market Size in 2034 | USD 6.92 Billion |
| CAGR | 17.9% (2026-2034) |
| Base Year for Estimation | 2025 |
| Historical Data | 2022-2024 |
| Forecast Period | 2026-2034 |
| Report Coverage | Revenue Forecast, Competitive Landscape, Supply Chain Disruption, Growth Factors, Environment & Regulatory Landscape and Trends |
Explore more data points, trends and opportunities Download Free Sample Report
Automotive Hypervisor Market Segmentation
The market is segmented by type and application, with Type 1 hypervisors dominating at 52% share, followed by Type 2 at 31% and hybrid at 17%. Passenger vehicles lead application share at 72%, while EVs are the fastest-growing segment at 22% CAGR.
By Type
Type 1 hypervisors dominate due to direct hardware interaction, accounting for 52% of deployments in 2025. Over 27 million growth units were integrated into vehicles, offering latency below 40 microseconds and CPU utilization efficiency above 90%. These hypervisors are widely used in ADAS and real-time applications due to their high reliability and security compliance. Adoption is particularly strong in China and Japan, where over 60% of premium vehicles utilize Type 1 virtualization.
Type 2 hypervisors hold a 31% share, with approximately 16 million units deployed. These systems operate on host OS platforms and are preferred for infotainment and non-critical applications. Their lower cost (USD 25–60 per unit) and easier integration make them suitable for mid-range vehicles. However, latency levels (70–120 microseconds) limit usage in safety-critical systems.
Hybrid hypervisors account for 17% share and combine features of Type 1 and Type 2 systems. Around 8 million units were deployed in 2025, offering flexible performance and moderate latency (~55 microseconds). These systems are increasingly used in electric vehicles due to multi-function integration capabilities.
By Application
Passenger vehicles dominate with 72% share, representing over 38 million units in 2025. Hypervisors enable integrated infotainment, navigation, and ADAS features. Adoption rates exceed 64% in premium vehicles and 41% in mid-range models. Increased consumer demand for connectivity drives growth.
Commercial vehicles account for 18% share, with around 9.4 million units deployed. Hypervisors are used for fleet management, telematics, and safety monitoring. Adoption is growing at 14.6% annually, particularly in logistics and transportation sectors.
Electric vehicles hold 10% share but are growing rapidly. Over 5.2 million EVs incorporated hypervisors in 2025, with usage focused on battery management and autonomous driving systems. Adoption is expected to exceed 25% share by 2030.
Asia Pacific Automotive Hypervisor Market Segmentations
By Type
- Type 1
- Type 2
- Hybrid
By Application
- Passenger Vehicles
- Commercial Vehicles
- Electric Vehicles
Asia Pacific Automotive Hypervisor Market Regional Outlook
China leads with 48.6% share, producing over 31.2 million vehicles. EV adoption exceeds 28%, and hypervisor integration is growing at 19.8% annually. Domestic OEMs and global vendors dominate.
South Korea holds a 9.4% share, with a strong presence of technology-driven OEMs. Production reached 4.2 million units, and hypervisor adoption stands at 44%.
Japan accounts for 14.2% share, producing 8.7 million vehicles. Advanced R&D and ADAS integration drive demand, with 52% adoption in premium vehicles.
India holds 8.1% share, producing 5.6 million vehicles. Adoption remains lower at 21% but is growing rapidly due to EV expansion.
Australia contributes 3.2% share, focusing on imports and connected vehicle adoption.
Singapore holds a 2.4% share, emphasizing smart mobility solutions and autonomous testing.
Taiwan accounts for 4.3% share, driven by semiconductor ecosystem support.
Southeast Asia collectively contributes 9.8%, with Thailand and Indonesia leading production growth.
Top players in the Asia-Pacific automotive hypervisor market
- BlackBerry Limited
- NXP Semiconductors
- Renesas Electronics
- Continental AG
- Bosch
- Siemens AG
- Green Hills Software
- Wind River Systems
- IBM Corporation
- VMware Inc.
- Huawei Technologies
- TTTech Auto
BlackBerry Limited
-
Holds 18.4% market share with QNX platform dominance
-
Strong presence in China and Japan with over 195 OEM partnerships
-
High reliability and ISO compliance position it as a leader
NXP Semiconductors
-
Commands 14.2% share with integrated hardware-software solutions
-
Supplies to over 60% of Asia Pacific OEMs
-
Strong in EV and ADAS segments with high-performance chips
Investment Analysis
Investments in the automotive hypervisor sector exceeded USD 2.3 billion in 2025, with 41% allocated to software development, 29% to hardware integration, and 30% to R&D. China accounts for 46% of total investments, followed by Japan at 18% and South Korea at 12%. Venture capital funding grew by 22% annually, focusing on AI-driven hypervisor platforms.
M&A activity increased by 27% between 2023 and 2025, with over 35 acquisitions recorded. Strategic collaborations between OEMs and software vendors rose by 33%, enhancing ecosystem development. Investments in EV-related hypervisor technologies grew by 38%, reflecting an industry shift.
New Product Developments
New product launches increased by 31% in 2025, focusing on improved latency and security. Performance improvements reached 25–40%, while power efficiency increased by 18%. Vendors introduced AI-enabled hypervisors with predictive analytics capabilities.
Recent Developments in the Asia-Pacific Automotive Hypervisor Market
- 2025: BlackBerry expanded QNX adoption by 21%, increasing deployments to over 235 OEM models across Asia Pacific.
- 2025: Huawei increased automotive software investments by 29%, expanding market presence in China.
Research Methodology
The research process combines primary and secondary data collection methodologies. Primary research includes interviews with over 120 industry experts, OEMs, and suppliers across Asia Pacific. Secondary research involves analysis of company reports, production databases, and government publications. Market size estimation uses bottom-up and top-down approaches, integrating production volumes, adoption rates, and pricing models. Data validation is conducted through triangulation methods, ensuring accuracy within ±5% variance. The methodology ensures reliable insights into the automotive hypervisor market's size, share, growth, and trend.
Frequently Asked Questions
Market Research Analyst | 8 Years Experience | Automotive Components and Aftermarket
Brenda Johnson is a market research analyst with 7–9 years of experience specializing in automotive markets. Contributed to 70+ research reports for global clients. Expertise includes market sizing, forecasting, competitive analysis, and trend evaluation across key regions.