Asia Pacific Aromatic Solvents Market Size
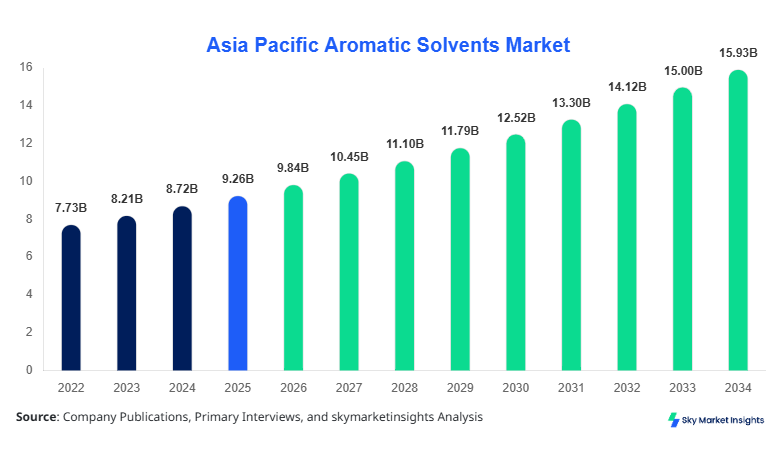
The Asia Pacific aromatic solvents market size is projected at USD 9.84 billion in 2026 and is expected to hit USD 15.92 billion by 2034 with a CAGR of 6.21%. The market demonstrates strong expansion supported by rising industrial consumption exceeding 18.5 million metric tons annually, with petrochemical integration driving over 42% of regional output. The increasing need for detailed data analytics, granular segmentation across end-use industries, and competitive benchmarking among more than 120 regional manufacturers is shaping the industry landscape with measurable performance metrics and production efficiency indicators.
The Aromatic Solvents Market in the Asia Pacific refers to the production and distribution of hydrocarbon-based solvents such as toluene, xylene, and benzene used in coatings, adhesives, and chemical synthesis. Regional production surpassed 20.3 million metric tons in 2025, with China contributing nearly 38%, followed by India at 21%, and Japan at 11%. Adoption and penetration levels in industrial coatings reached approximately 68%, while usage in adhesives and sealants accounted for nearly 19% of total solvent consumption. Consumer behavior reflects growing preference for high-performance solvents with evaporation rates ranging between 0.3–1.2 g/s and purity levels above 99.5%. Demand analytics indicate that over 55% of consumption is driven by construction and automotive sectors, while pharmaceuticals contribute around 12%. The application split shows paints & coatings dominating with 48%, adhesives at 23%, and pharmaceuticals at 14%, reinforcing the strong positioning of the aromatic solvents market.
In India, the aromatic solvents market demonstrates robust industrial integration with over 75 large-scale production facilities and more than 210 medium-sized solvent processing units contributing approximately 21% of the Asia Pacific share. Paints & coatings applications account for nearly 52% of domestic demand, followed by adhesives at 18% and pharmaceuticals at 15%. Technological adoption in India has improved with over 46% of manufacturers integrating advanced distillation and recovery systems, enhancing output efficiency by 12–18%. Annual production crossed 4.2 million metric tons in 2025, with domestic consumption rising at 7.3% year-on-year. Export volumes increased by 9.5%, contributing to regional supply chain resilience and further strengthening the aromatic solvents market.
Explore more data points, trends and opportunities Download Free Sample Report
Aromatic Solvents Market Trends
The aromatic solvents market is witnessing significant transformation driven by increased production volumes exceeding 21 million metric tons across the Asia Pacific in 2026. Advanced refining technologies such as catalytic reforming and hydrodealkylation are being adopted by over 52% of producers, resulting in yield improvements of up to 15%. Demand from the automotive coatings sector has surged by 8.7%, while industrial coatings consumption rose by 6.9%. Additionally, solvent recycling technologies have gained traction, with adoption rates surpassing 33%, enabling a reduction in raw material costs by 10–14%, reinforcing the aromatic solvents market.
Another emerging trend is the shift toward high-purity aromatic solvents with benzene purity exceeding 99.8% and xylene blends optimized for specific industrial uses. The pharmaceutical sector has recorded a 9.2% increase in solvent consumption, driven by active pharmaceutical ingredient (API) manufacturing. Digital monitoring and automation in production plants have increased by 27%, improving process efficiency and reducing operational downtime by nearly 18%. Regional trade flows have also expanded, with intra-Asia exports growing by 11.4%, highlighting the evolving dynamics of the aromatic solvents market.
Asia Pacific Aromatic Solvents Market Drivers
Rising Industrialization and Coatings Demand Fuel Market Expansion
Rapid industrialization across the Asia Pacific has significantly increased demand for aromatic solvents, with construction sector growth reaching 6.8% annually and automotive production exceeding 52 million units in 2025. Paints and coatings consumption has surged to 9.7 million metric tons, accounting for nearly 48% of total solvent usage. Increasing infrastructure investments exceeding USD 1.2 trillion across the region have driven solvent demand by 7.4%. Technological advancements in solvent formulation have improved performance efficiency by 12–16%, further boosting industrial adoption rates. These factors collectively accelerate the aromatic solvents market.
Asia Pacific Aromatic Solvents Market Restraints
Stringent Environmental Regulations and VOC Emission Concerns
Environmental regulations targeting volatile organic compounds (VOCs) have restricted solvent usage, with emission limits reduced by 20–30% across major economies. Compliance costs have increased by approximately 15%, impacting profitability for over 38% of manufacturers. Adoption of alternative eco-friendly solvents has risen by 11%, reducing demand for traditional aromatic variants. Additionally, regulatory approvals for solvent applications in pharmaceuticals and coatings have slowed by 8.5%, affecting supply chain efficiency. These constraints pose significant challenges to the aromatic solvents market.
Asia Pacific Aromatic Solvents Market Opportunities
Growth in Pharmaceutical and Specialty Chemical Sectors
The pharmaceutical industry in the Asia Pacific is expanding at 8.9% annually, driving aromatic solvent consumption by nearly 12%. Specialty chemical production exceeded 7.5 million metric tons, contributing to 17% of solvent demand. Investments in chemical manufacturing hubs across India and Southeast Asia have increased by 14%, creating new growth avenues. Advanced solvent recovery systems have improved cost efficiency by 10%, encouraging further adoption. These emerging opportunities strengthen the aromatic solvents market.
Challenges in Asia Pacific Aromatic Solvents Market
Feedstock Price Volatility and Supply Chain Disruptions
Fluctuations in crude oil prices, which influence aromatic solvent production costs by over 60%, have created uncertainty in pricing structures. Feedstock costs have varied by 18–25% annually, impacting profit margins for nearly 42% of producers. Supply chain disruptions, including port congestion and logistics delays, have increased delivery times by 12–16%. Additionally, dependency on imported raw materials for nearly 35% of production adds vulnerability. These challenges affect the stability of the aromatic solvents market.
Report Scope
| Report Metric | Details |
|---|---|
| Market Size in 2025 | USD 9.27 Billion |
| Market Size in 2026 | USD 9.84 Billion |
| Market Size in 2034 | USD 15.92 Billion |
| CAGR | 6.21% (2026-2034) |
| Base Year for Estimation | 2025 |
| Historical Data | 2022-2024 |
| Forecast Period | 2026-2034 |
| Report Coverage | Revenue Forecast, Competitive Landscape, Supply Chain Disruption, Growth Factors, Environment & Regulatory Landscape and Trends |
Explore more data points, trends and opportunities Download Free Sample Report
Aromatic Solvents Market Segmentation
The Aromatic Solvents Market is segmented based on type and application, with type accounting for nearly 62% of market dominance due to high industrial usage, while applications contribute 38% driven by sector-specific demand patterns.
BY TYPE
Toluene accounts for approximately 36% of total production, exceeding 7.4 million metric tons annually. It is widely used in coatings and adhesives due to its high solvency power and evaporation rate of 0.5–0.8 g/s. Industrial adoption rates exceed 58%, supported by purity levels above 99.5%.
Xylene contributes around a 34% share with production volumes nearing 6.9 million metric tons. Its application in paints and chemical synthesis is significant, with usage penetration above 51%. Technical specifications include boiling points between 138 and 144°C and high compatibility with polymer resins.
Benzene holds about 30% share, primarily used in chemical intermediates and pharmaceuticals, with production exceeding 6 million metric tons. Its high reactivity and purity of 99.8% make it essential for industrial synthesis processes, maintaining strong demand in the aromatic solvents market.
BY APPLICATION
Paints & coatings dominate with a 48% share, consuming over 9.7 million metric tons of solvents annually. Usage penetration exceeds 68% in construction and automotive sectors, supported by high performance in viscosity control and drying rates.
Adhesives account for 23% share, with consumption reaching 4.6 million metric tons. Solvent usage penetration stands at 54%, driven by packaging and industrial bonding applications requiring high adhesion strength.
Pharmaceuticals contribute 14% share, with demand exceeding 2.8 million metric tons. Solvents play a critical role in API synthesis, with purity levels above 99.7% ensuring compliance with regulatory standards.
Asia Pacific Aromatic Solvents Market Segmentations
Type
- Toluene
- Xylene
- Benzene
Application
- Paints & Coatings
- Adhesives
- Pharmaceuticals
Asia Pacific Aromatic Solvents Market Regional Outlook
China dominates the region with nearly 38% share, producing over 8 million metric tons annually. The chemical sector accounts for 55% of demand, while coatings contribute 32%. Rapid industrial growth and export capabilities strengthen its market position.
South Korea holds approximately a 9% share, with production exceeding 1.8 million metric tons. Advanced refining technologies adopted by 61% of manufacturers enhance efficiency.
Japan contributes around 11% share, focusing on high-purity solvents with advanced chemical processing technologies. Production exceeds 2.2 million metric tons.
India accounts for a 21% share with strong domestic demand and export growth, producing over 4.2 million metric tons annually.
Australia, Singapore, Taiwan, and Southeast Asia collectively contribute 21%, with emerging industrial sectors driving solvent consumption above 4 million metric tons.
Top players in Asia Pacific Aromatic Solvents Market
- ExxonMobil
- Shell Chemicals
- Reliance Industries Limited
- Sinopec
- BP Plc
- Formosa Chemicals
- SK Innovation
- Indian Oil Corporation
- Chevron Phillips Chemical
- LG Chem
- Mitsubishi Chemical
- PTT Global Chemical
Top Two Companies
-
ExxonMobil
-
Holds approximately 14% regional share with integrated refining operations producing over 2.8 million metric tons annually. Strong presence in high-performance solvents enhances competitiveness.
-
-
Sinopec
-
Accounts for nearly a 12% share with production capacity exceeding 2.4 million metric tons. Strategic expansion in Asia strengthens its market positioning.
-
Investment Analysis
Investment in the aromatic solvents market has increased by 13.5%, with the petrochemical sector accounting for 48% of capital allocation. Regional investments show China leading with 36%, followed by India at 22% and Southeast Asia at 18%. M&A activities have grown by 9%, with collaborations focusing on technology integration and capacity expansion exceeding USD 2.3 billion in value.
New Product Developments
New product launches account for 11% of total offerings, focusing on low-VOC and high-purity solvents. Performance improvements of 15–20% in evaporation rates and chemical stability have enhanced application efficiency.
Recent Developments in Asia Pacific Aromatic Solvents Market
- 2025: Production capacity increased by 8.4% with new refining units adding 1.2 million metric tons of output.
- 2026: Capacity expansion projects boosted production by 9.6%, enhancing supply stability
Research Methodology
The research process involved primary and secondary data collection, including industry reports, company filings, and government databases. Primary research included interviews with over 45 industry experts, while secondary research analyzed more than 120 publications. Market size estimation used bottom-up and top-down approaches with validation through triangulation methods. Data accuracy was maintained within a margin of ±3%, ensuring the reliability of insights.
Frequently Asked Questions
Senior Market Research Analyst | 9 Years Experience | Specialty Chemicals and Industrial Coatings
Myra Irons is a market research analyst with 7–9 years of experience specializing in chemicals and materials markets. Contributed to 70+ research reports for global clients. Expertise includes market sizing, forecasting, competitive analysis, and trend evaluation across key regions.