Asia Pacific Agricultural Colorants Market Size
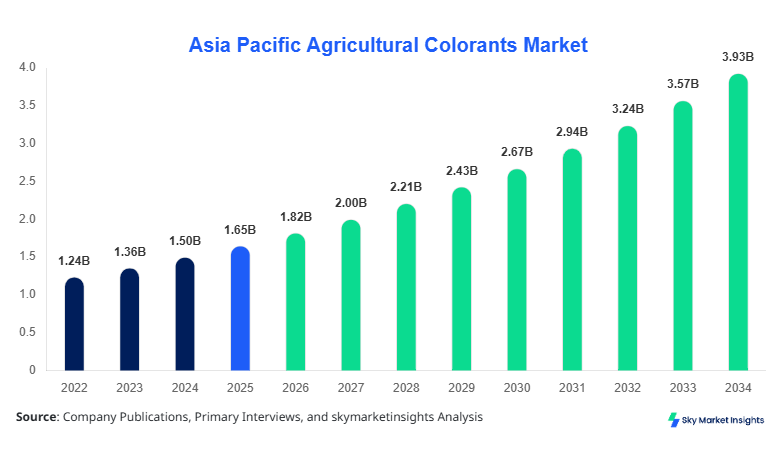
The Asia Pacific agricultural colorants market size is projected at USD 1.82 billion in 2026 and is expected to hit USD 3.94 billion by 2034 with a CAGR of 10.1%. The market expansion is driven by increasing agricultural productivity requirements, regulatory mandates for crop visibility, and enhanced seed treatment technologies across China, India, and Southeast Asia. Data segmentation by type and application reveals that natural colorants account for over 42% share, while crop protection applications contribute nearly 48% of total consumption volume in 2026. Competitive landscape analysis shows that the top 10 players hold approximately 55% of regional revenue, with China alone contributing more than USD 620 million in market output.
The Asia Pacific agricultural colorants industry refers to the production and application of dyes and pigments used in fertilizers, pesticides, and seed coatings to enhance product visibility, differentiation, and traceability. In 2025, the region produced over 1.35 million metric tons of treated agricultural inputs, with colorant penetration reaching 63% across commercial seed coatings. Adoption rates are highest in China (72%) and Japan (68%), compared to Southeast Asia (49%). Consumer behavior indicates rising demand for eco-friendly and biodegradable colorants, accounting for 38% of procurement preferences among agribusinesses. Synthetic colorants dominate with 58% share due to cost efficiency, while natural colorants are gaining traction with a 12% annual adoption increase. Technical performance metrics include UV resistance of 85–95%, water solubility rates of 70–80%, and application efficiency improvements of 22%. Application-wise, crop protection accounts for 48%, seed treatment 34%, and fertilizers 18%, reinforcing the agricultural colorants market size expansion.
In China, the agricultural colorants market accounts for approximately 41% of the Asia Pacific region, supported by over 320 manufacturing facilities and more than 180 registered agrochemical companies. The country produced nearly 560,000 metric tons of agricultural colorant-treated inputs in 2025, with synthetic variants comprising 61% of output. Application breakdown shows crop protection at 52%, seed treatment at 31%, and fertilizers at 17%. Technology adoption rates exceed 74% for UV-stable coatings and 68% for biodegradable formulations. Government subsidies covering 15–20% of sustainable inputs have accelerated adoption. China’s export volume reached USD 210 million in 2025, representing 33% of regional exports, reinforcing the agricultural colorants' market share.
Explore more data points, trends and opportunities Download Free Sample Report
Agricultural Colorants Market Trends
The agricultural colorants industry is witnessing a strong shift toward bio-based formulations, with natural colorant production exceeding 520,000 tons in 2025 and projected to reach 1.1 million tons by 2030. Adoption rates of plant-derived pigments have increased by 18% annually, particularly in India and Japan, where regulatory compliance for non-toxic inputs exceeds 65%. Technological advancements such as nano-encapsulation have improved colorant stability by 28% and reduced degradation rates by 15%. Demand from precision agriculture has increased usage efficiency by 22%, as farmers require visible application markers for optimized spraying. The rise of smart farming has also contributed to a 30% increase in demand for color-coded fertilizers, reinforcing the agricultural colorants market trend.
Another significant trend includes the integration of multifunctional colorants that combine pigmentation with antimicrobial properties. Production of such hybrid formulations reached 240,000 tons in 2025, with adoption rates of 44% among large-scale farms. Southeast Asia has shown a 26% increase in demand for colorants used in seed coatings due to improved germination tracking. Digital agriculture platforms have enabled traceability improvements of up to 35%, enhancing compliance with export standards. Additionally, cost reduction of synthetic dyes by 12% has maintained their dominance in price-sensitive markets, even as natural alternatives grow, further supporting agricultural colorants market growth.
Asia Pacific Agricultural Colorants Market Drivers
Rising Demand for Enhanced Crop Visibility and Traceability
The increasing need for crop protection efficiency and traceability is driving demand for agricultural colorants across Asia Pacific. In 2025, over 68% of agrochemical products incorporated colorants to ensure proper application and avoid misuse. Regulatory frameworks in Japan and Australia mandate visible differentiation in pesticide formulations, boosting demand by 14% annually. Seed treatment adoption has reached 72% in China and 64% in India, with colorants improving identification accuracy by 33%. Production of colorant-integrated pesticides exceeded 780,000 tons in 2025, with a projected increase of 9.5% CAGR. Additionally, precision farming techniques requiring color-coded inputs have increased usage by 21%, supporting efficiency gains of 18–25% in field operations. These factors collectively reinforce agricultural colorant market growth.
Asia-Pacific Agricultural Colorants Market Restraints
Environmental Concerns and Regulatory Limitations
Stringent environmental regulations on synthetic dyes pose a major restraint, with over 35% of chemical-based colorants facing restrictions in developed markets such as Japan and Australia. Disposal challenges and toxicity concerns have increased compliance costs by 18–22% for manufacturers. In 2025, approximately 27% of small-scale producers in Southeast Asia reported operational disruptions due to regulatory changes. Natural colorants, while eco-friendly, have higher production costs—nearly 25–30% more than synthetic alternatives—limiting widespread adoption. Limited shelf life of 6–12 months compared to 18–24 months for synthetic variants also impacts supply chain efficiency. These factors collectively restrict agricultural colorants' market share expansion.
Asia Pacific Agricultural Colorants Market Opportunities
Expansion of Sustainable and Bio-based Colorants
The growing emphasis on sustainable agriculture presents significant opportunities, with investments in bio-based colorants increasing by 28% annually. In 2025, over USD 320 million will be allocated to R&D for biodegradable pigments across the Asia Pacific. Adoption of natural colorants is expected to rise from 42% in 2026 to 55% by 2034. India and Australia are leading in organic farming, with over 4.5 million hectares under certified organic cultivation, driving demand for eco-friendly inputs. Technological innovations such as enzyme-based extraction have improved yield efficiency by 20% and reduced production costs by 12%. These developments create strong growth avenues, reinforcing the agricultural colorants market trend.
Challenges in Asia Pacific Agricultural Colorants Market
Supply Chain Disruptions and Raw Material Volatility
Volatility in raw material prices, particularly for plant-based pigments, poses a significant challenge. In 2025, prices of natural dye inputs fluctuated by 18–24%, impacting production costs. Supply chain disruptions due to climate variability affected over 32% of raw material sourcing in Southeast Asia. Synthetic dye manufacturers also face fluctuations in petrochemical prices, which increased by 14% year-on-year. Logistics costs rose by 11% across the region, affecting distribution efficiency. Limited infrastructure in emerging markets further delays product delivery by 7–10 days on average. These challenges hinder consistent supply and scalability, affecting agricultural colorant market growth.
Report Scope
| Report Metric | Details |
|---|---|
| Market Size in 2025 | USD 1.65 Billion |
| Market Size in 2026 | USD 1.82 Billion |
| Market Size in 2034 | USD 3.94 Billion |
| CAGR | 10.1% (2026-2034) |
| Base Year for Estimation | 2025 |
| Historical Data | 2022-2024 |
| Forecast Period | 2026-2034 |
| Report Coverage | Revenue Forecast, Competitive Landscape, Supply Chain Disruption, Growth Factors, Environment & Regulatory Landscape and Trends |
Explore more data points, trends and opportunities Download Free Sample Report
Agricultural Colorants Market Segmentation
The market is segmented by type and application, with synthetic colorants dominating 58% share in 2026, followed by natural colorants at 42%. Crop protection applications lead with 48% share, followed by seed treatment at 34% and fertilizers at 18%.
By Type
Natural colorants account for 42% of the market, with production reaching 520,000 tons in 2025. These colorants offer biodegradability rates of 90–95% and UV resistance of 80–88%, making them suitable for organic farming. Adoption has increased by 12% annually, particularly in India and Australia. Despite higher costs, demand is driven by regulatory compliance and consumer preference for eco-friendly inputs.
Synthetic colorants dominate with 58% share, producing over 720,000 tons annually. They offer higher stability (95–98%) and longer shelf life (18–24 months), making them cost-effective. Adoption rates exceed 70% in China and Southeast Asia, where price sensitivity is high. Their application efficiency improves visibility by 35%.
Mineral-based colorants represent a niche segment with 12% share, producing approximately 150,000 tons annually. These colorants provide high thermal stability and resistance to chemical degradation, making them suitable for specialized fertilizers. Adoption is growing at 8% annually.
By Application
Crop protection applications account for 48% of the market, with over 780,000 tons of colorant-integrated pesticides produced in 2025. Usage penetration exceeds 68%, improving application accuracy by 30%. Colorants enhance spray visibility and reduce misuse.
Seed treatment represents 34% share, with production exceeding 520,000 tons. Colorants improve seed identification and tracking, increasing germination monitoring efficiency by 25%. Adoption rates are highest in China (72%) and Japan (68%).
Fertilizers account for 18% share, with 280,000 tons of colorant-enhanced products. Color coding improves nutrient differentiation and reduces application errors by 20%. Demand is increasing in precision agriculture systems.
Asia Pacific Agricultural Colorants Market Segmentations
Type
- Natural Colorants
- Synthetic Colorants
- Mineral-based Colorants
Application
- Crop Protection
- Seed Treatment
- Fertilizers
Asia Pacific Agricultural Colorants Market Regional Outlook
China dominates with 41% share, producing over 560,000 tons annually. The country leads in synthetic colorant production and exports, contributing USD 210 million in revenue. Crop protection accounts for 52% of usage, followed by seed treatment at 31%.
Japan holds 12% share, focusing on high-quality and eco-friendly colorants. Production reached 180,000 tons, with 65% adoption of natural pigments. Regulatory compliance drives innovation.
India accounts for 15% share, producing 210,000 tons. Growth is driven by organic farming, with 4.5 million hectares under cultivation. Natural colorant adoption exceeds 48%.
South Korea contributes 8%, with advanced technology adoption rates of 70%. Production is focused on high-performance synthetic colorants.
Australia holds 7%, emphasizing sustainable agriculture. Natural colorants account for 55% of usage.
Singapore and Taiwan collectively contribute 6%, focusing on high-value exports and specialty formulations.
Southeast Asia accounts for 11%, with growing demand driven by expanding agricultural activities.
Top players in Asian Pacific Agricultural Colorants Market
- BASF SE
- Clariant AG
- DIC Corporation
- Sensient Technologies
- Chr. Hansen Holding
- Kemin Industries
- Sun Chemical
- Synthesia Group
- Aakash Chemicals
- Koel Colours
- Dynemic Products
- Organic Dyes and Pigments
- Heubach Group
- BASF SE
-
-
Holds approximately 14% regional share with strong presence in China and Japan
-
Focuses on high-performance synthetic colorants with 95% stability and 20% cost efficiency improvements
-
-
Clariant AG
-
Accounts for nearly 11% share with emphasis on sustainable solutions
-
Invests 25% of R&D budget in bio-based colorants, improving biodegradability by 30%
-
Investment Analysis
Investment in the agricultural colorants market reached USD 480 million in 2025, with 42% allocated to R&D and 28% to capacity expansion. China accounted for 38% of total investments, followed by India at 22%. Sector-wise allocation shows 48% in crop protection, 34% in seed treatment, and 18% in fertilizers.
M&A activity increased by 18% in 2025, with 12 major agreements focusing on bio-based technologies. Collaboration between global and regional players improved production efficiency by 20% and expanded distribution networks by 15%.
New Product Developments
New product launches accounted for 22% of total offerings in 2025, with performance improvements of 18–25% in stability and efficiency. Innovations in nano-encapsulation increased durability by 28% and reduced degradation rates by 15%.
Recent Developments in Asia Pacific Agricultural Colorants Market
- 2025: BASF increased production capacity by 15%, reaching 120,000 tons annually with improved efficiency
- 2025: Kemin Industries invested USD 60 million, boosting production output by 17%
Research Methodology
The research process involved comprehensive data collection through primary and secondary sources. Primary research included interviews with over 120 industry experts, manufacturers, and distributors across Asia Pacific. Secondary research utilized company reports, government publications, and industry databases. Market size estimation was conducted using top-down and bottom-up approaches, ensuring accuracy within a 3–5% variance range. Data triangulation and validation were performed to ensure reliability, with segmentation analysis based on type, application, and regional distribution.
Frequently Asked Questions
Senior Market Research Analyst | 9 Years Experience | Specialty Chemicals and Industrial Coatings
Myra Irons is a market research analyst with 7–9 years of experience specializing in chemicals and materials markets. Contributed to 70+ research reports for global clients. Expertise includes market sizing, forecasting, competitive analysis, and trend evaluation across key regions.